. 2003 Feb 15;23(4):1206-18.
doi: 10.1523/JNEUROSCI.23-04-01206.2003.

Modulation of spike-mediated synaptic transmission by presynaptic background Ca2+ in leech heart interneurons

Affiliations

Modulation of spike-mediated synaptic transmission by presynaptic background Ca2+ in leech heart interneurons

Andrei I Ivanov et al. J Neurosci. .

Abstract

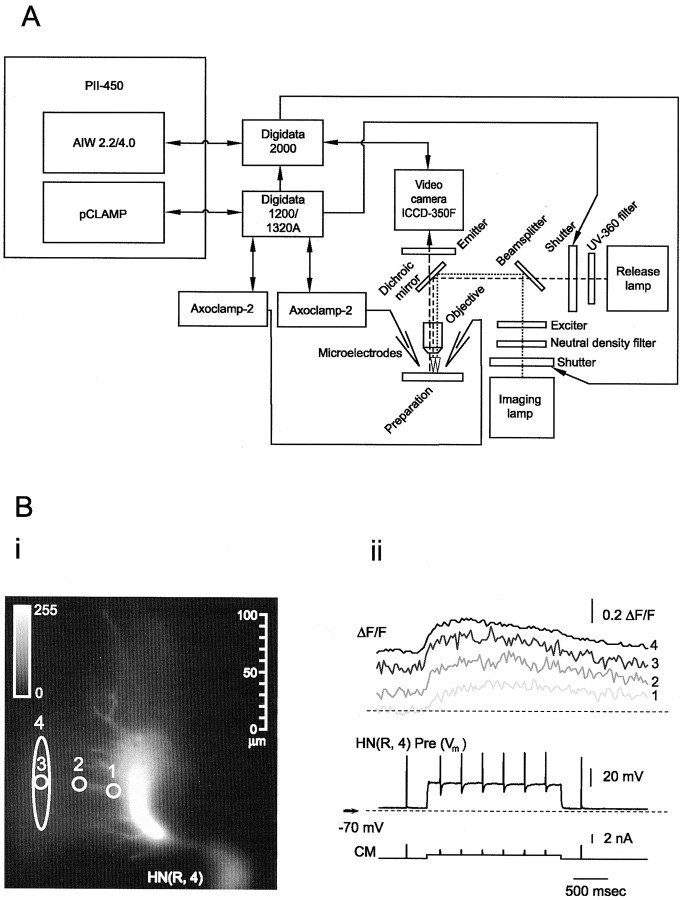
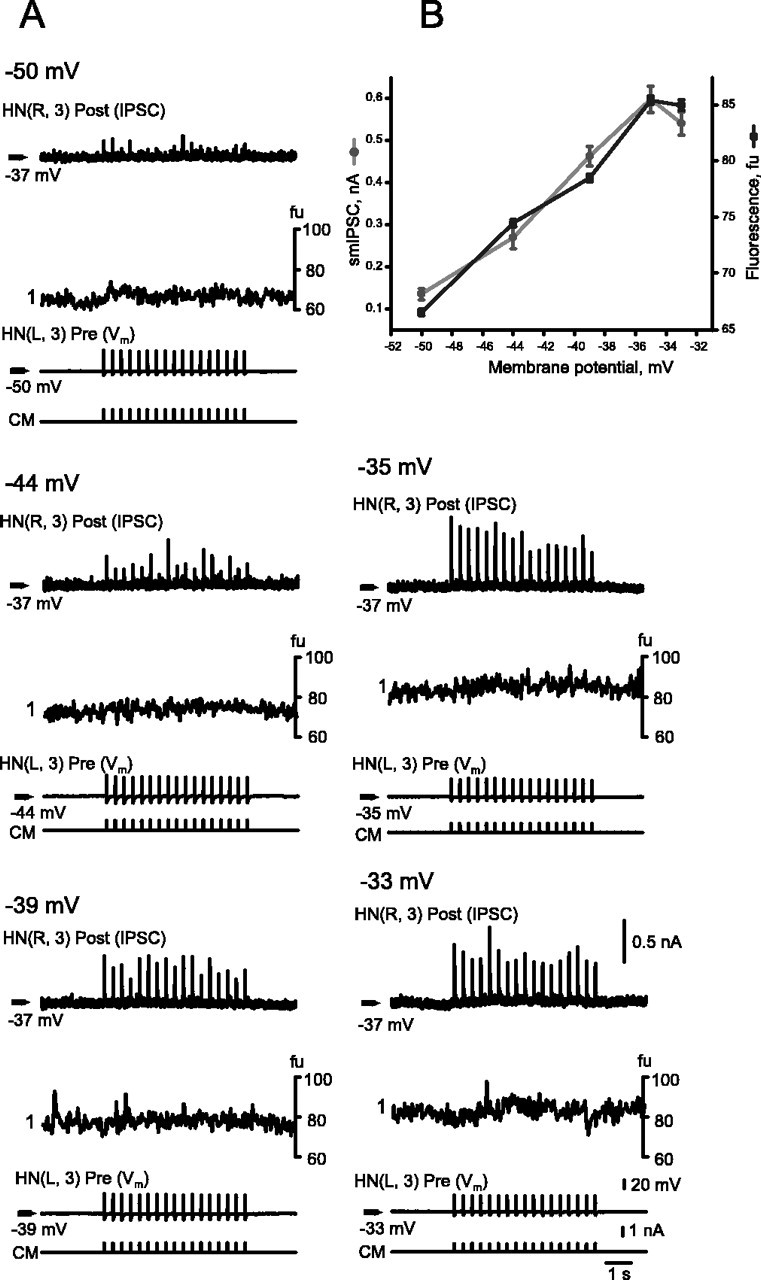
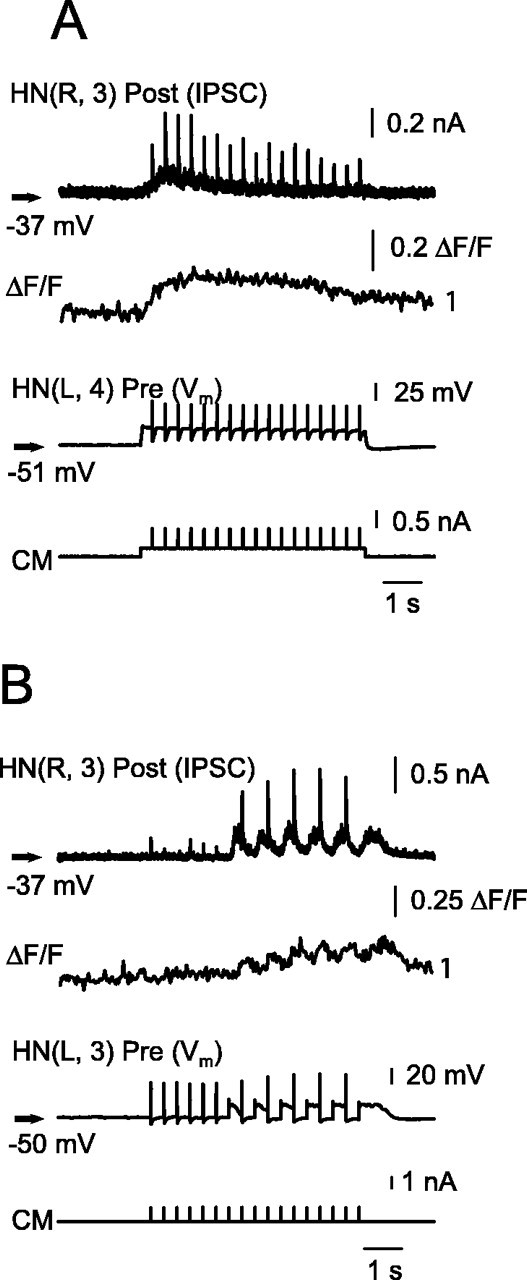
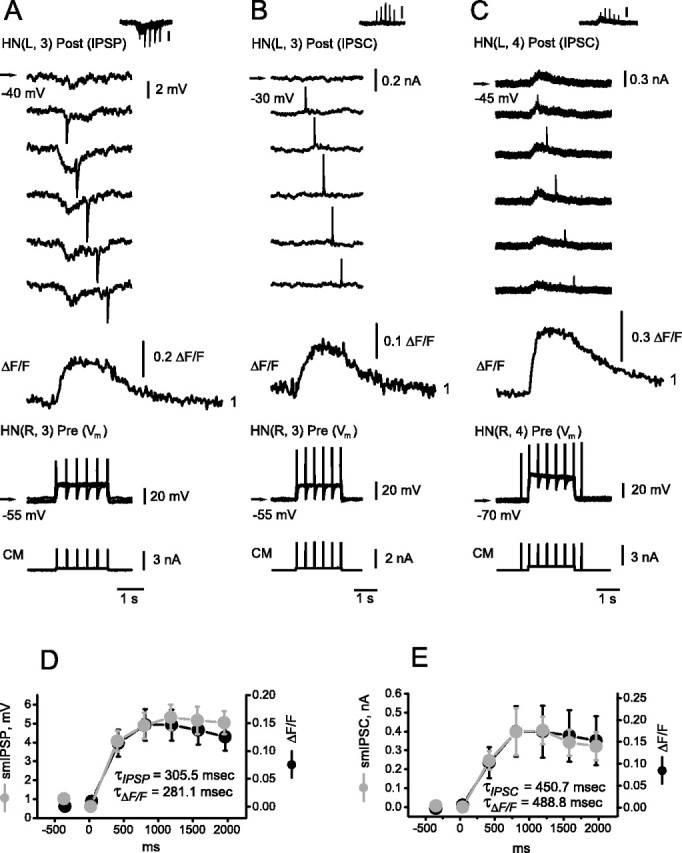
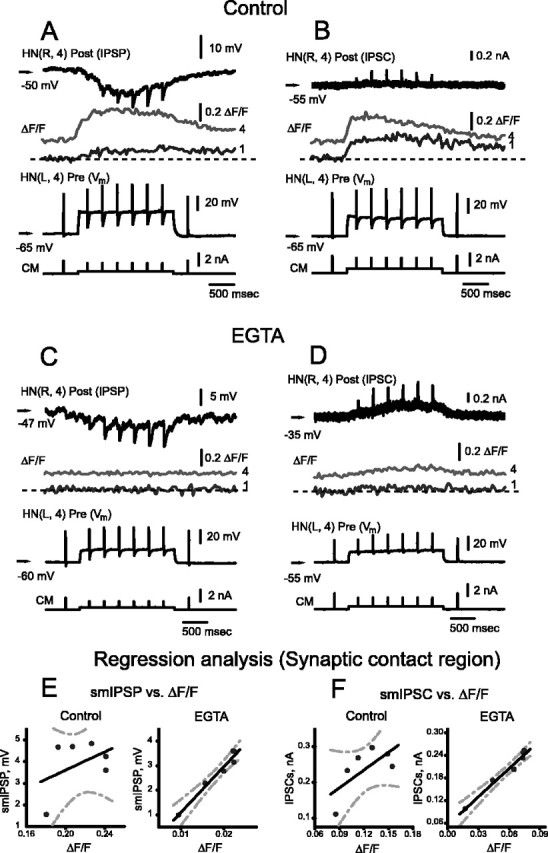
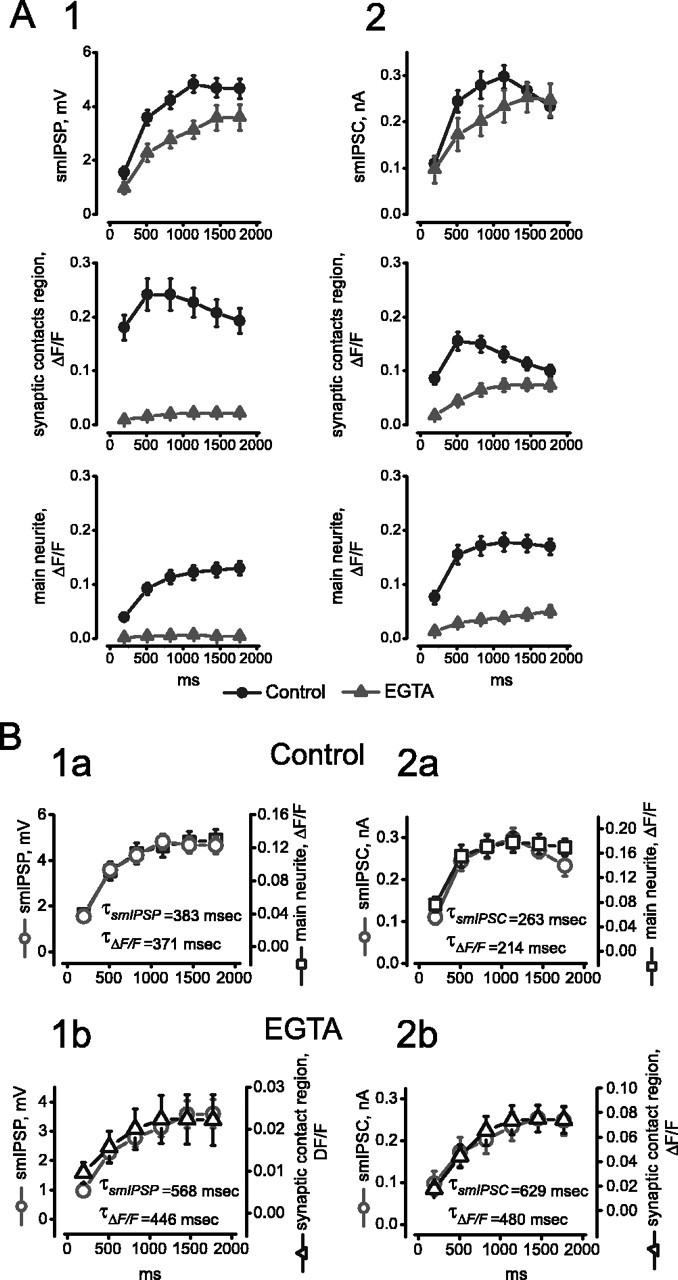
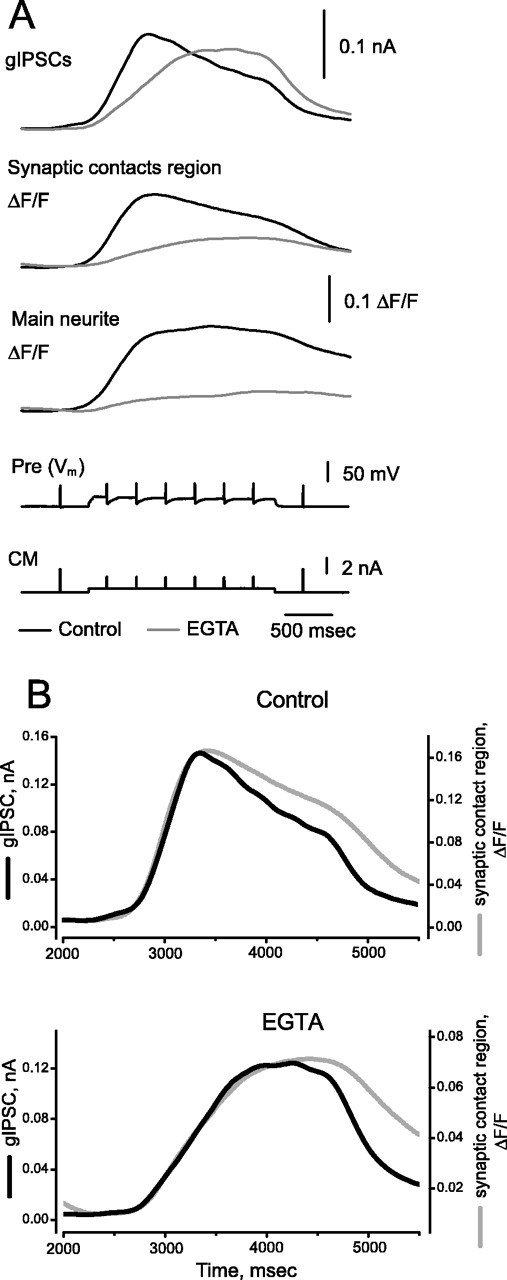
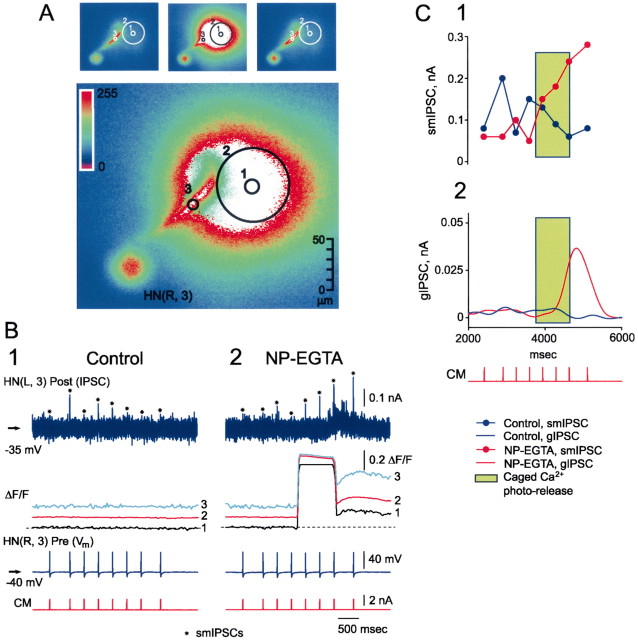
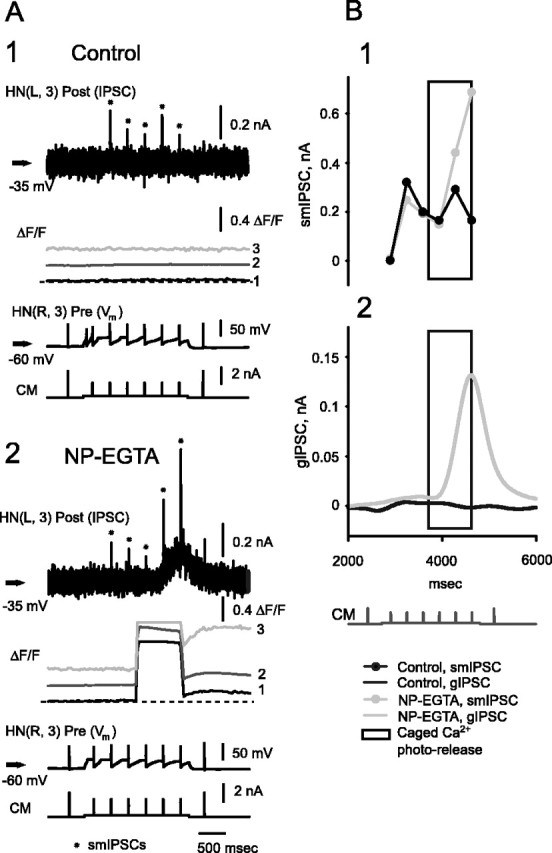
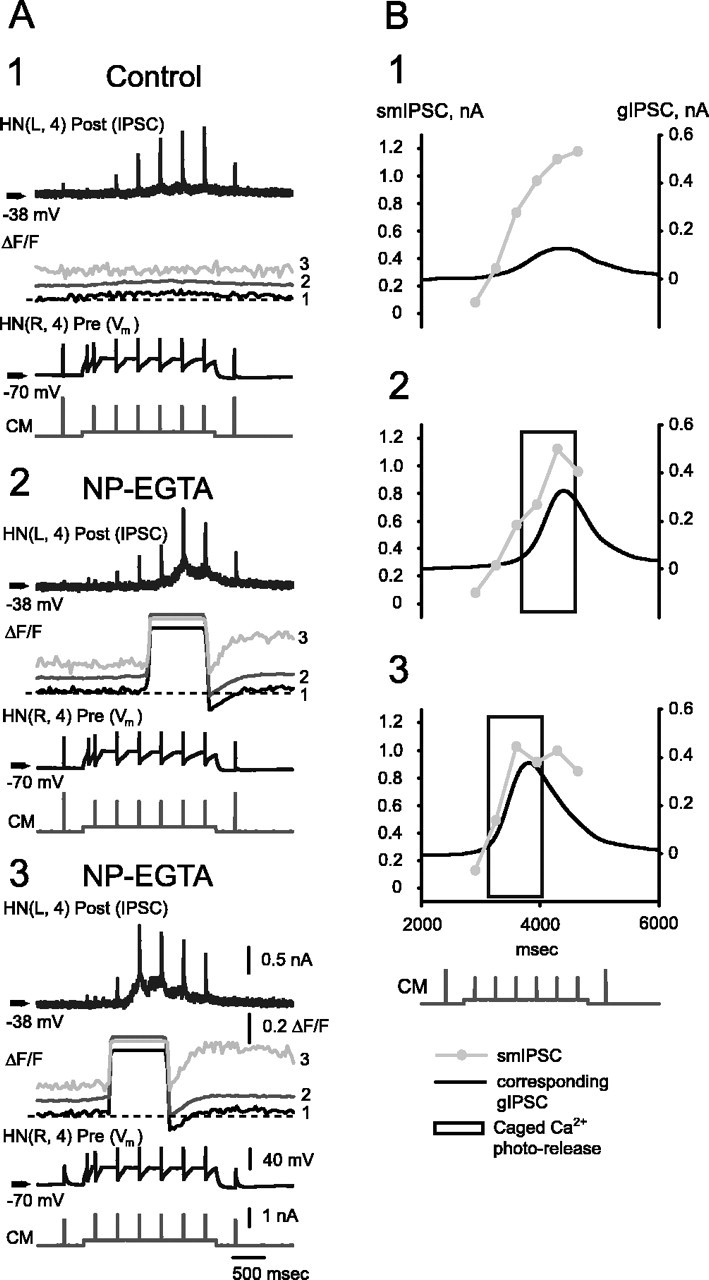
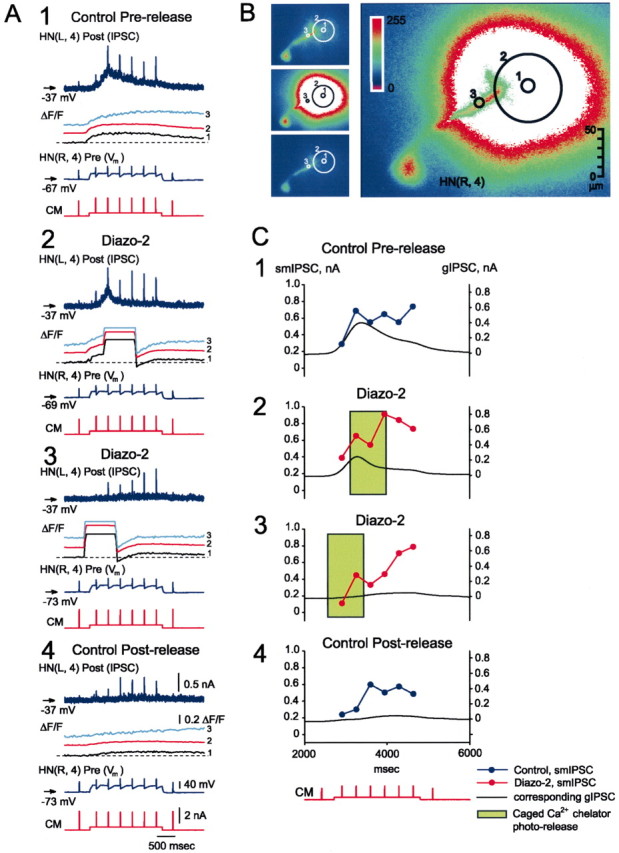
At the core of the rhythmically active leech heartbeat central pattern generator are pairs of mutually inhibitory interneurons. Synaptic transmission between these interneurons consists of spike-mediated and graded components, both of which wax and wane on a cycle-by-cycle basis. Low-threshold Ca2+ currents gate the graded component. Ca imaging experiments indicate that these low-threshold currents are widespread in the neurons and that they contribute to neuron-wide changes in internal background Ca2+ concentration (Ivanov and Calabrese, 2000). During normal rhythmic activity, background Ca2+ concentration oscillates, and thus graded synaptic transmission waxes and wanes as the neurons move from the depolarized to the inhibited phases of their activity. Here we show that in addition to gating graded transmitter release, the background Ca2+ concentration changes evoked by low-threshold Ca2+ currents modulate spike-mediated synaptic transmission. We develop stimulation paradigms to simulate the changes in baseline membrane potential that accompany rhythmic bursting. Using Ca imaging and electrophysiological measurements, we show that the strength of spike-mediated synaptic transmission follows the changes in background Ca2+ concentration that these baseline potential changes evoke and that it does not depend on previous spike activity. Moreover, we show using internal EGTA and photo-release of caged Ca2+ and caged Ca2+ chelator that changes in internal Ca2+ concentration modulate spike-mediated synaptic transmission. Thus activity-dependent changes in background Ca2+, which have been implicated in homeostatic regulation of intrinsic membrane currents and synaptic strength, may also regulate synaptic transmission in an immediate way to modulate synaptic strength cycle by cycle in rhythmically active networks.


Figures

Fig. 1.
Fig. 1.
A, Schematic of experimental setup.Lines with arrowheads indicate control communication lines and their direction. Dotted anddashed lines indicate light paths and beams, andlines ending in electrode symbols are electrical connections. B, Simultaneous recordings (ii) of electrophysiological activity and Ca fluorescence changes (ΔF/F) in fine branches. The preparation was mounted dorsal side up to image fine branches (i). A step depolarization (stimulus protocol used in several of the experiments reported) of the imaged cell led to a widespread change in Ca fluorescence recorded at the numbered circles/oval. Note that the fluorescence signal recorded in the oval(4), which covers a large portion of the synaptic contact region, is very similar to that recorded in a much more restricted portion of the synaptic contact region (3) but is less noisy. The fluorescence signal recorded near the main neurite (1) rises and falls more slowly than in the synaptic contact region (3, 4). In this and all subsequent images, the location and relative size of the fluorescence recording sites are indicated, but they are exaggerated in size for legibility, and in all images presented the intensity of fluorescence is coded by alinear gray/pseudocolor scale inset(0–255). In this and subsequent figures, membrane potential recordings (Vm) of heart interneurons are labeled HN and indexed by body side and ganglion number of the recorded cell. Vmrecords labeled Pre were from cells that were stimulated and thus functionally presynaptic. In each case, their Ca fluorescence signals were recorded synchronized with the voltage recordings. The current monitor trace for the Pre cell is labeledCM. In all the experiments illustrated in subsequent figures, postsynaptic responses to the Pre cell stimulation were recorded in the opposite (Post) heart interneuron in voltage clamp (IPSC) or current clamp (IPSP).
Fig. 2.
Fig. 2.
The amplitude of spike-mediated postsynaptic responses and the level of presynaptic background [Ca2+]i both increase with the presynaptic holding potential. A, Spikes were evoked at five different holding potentials (−50, −44, −39, −35, and −33 mV) while we simultaneously recorded (near the main neurite) the presynaptic level of background Ca fluorescence, presented in units of absolute fluorescence (0–255 fu), and spike-mediated IPSCs.B, Graph showing the relations of average spike-mediated IPSC (smIPSC) amplitude and Ca fluorescence with presynaptic holding potential. In this and in all subsequent figures, data are plotted as mean ± SE. All of the recordings are from the same preparation.
Fig. 3.
Fig. 3.
A, A simulated burst with underlying depolarization (spikes are superimposed on a step depolarization) produces an increase in Ca fluorescence (ΔF/F), graded synaptic transmission, and modulation of spike-mediated transmission. Spike-mediated IPSCs increase and then decrease during the simulated burst. B, A simulated burst without underlying depolarization (spikes superimposed on a steady holding potential) in an unusual preparation. See Results for further explanation.A and B show recordings from different preparations.
Fig. 4.
Fig. 4.
Plasticity in spike-mediated synaptic transmission evoked by a step depolarization follows the time course of changes in Ca florescence measured near the main neurite and is independent of previous spike activity. A–C, Single spikes were superimposed on a step depolarization at different times. Presynaptic recordings were superimposed, and Ca fluorescence (ΔF/F) signals were averaged. Postsynaptic responses are presented as individual traces (seeinsets for superimposed responses). Aillustrates experiments in which IPSPs were recorded (n = 16), and B and Cillustrate experiments (n = 7) in which IPSCs were recorded. In B no graded IPSC was recorded, but spike-mediated plasticity followed a similar time course as when a graded IPSC was recorded as in C. D,E, Spike-mediated postsynaptic responses (smIPSP in D and smIPSC inE) and the change in the Ca fluorescence signal (ΔF/F), averaged across experiments, are plotted versus the timing of the evoked spike from the start of the step depolarization. In some experiments (7 for recorded IPSPs and 5 for recorded IPSCs), a spike was evoked before the step depolarization as in C. A single exponential time constant was fitted to the rise of the postsynaptic responses (τIPSPIPSC) and the Ca fluorescence signal (τΔF/F) inD and E using ƒ(t) =Aieti+ C. A and B show recordings from the same preparation, and C shows recordings from a different preparation.
Fig. 5.
Fig. 5.
Plasticity in spike-mediated synaptic transmission evoked by a step depolarization (simulated burst protocol) compared with changes in Ca fluorescence. Ca fluorescence (ΔF/F) was measured at two sites corresponding to the numbered areas in Figure1B. Postsynaptic responses were measured as IPSPs (A, C) or IPSCs (B,D). E, F, Regression analysis of the spike-mediated postsynaptic responses (E,smIPSP; F,smIPSC) versus Ca fluorescence (ΔF/F) in the synaptic contact region (4) averaged across experiments shows significant linear dependence only in the presence of internal EGTA.Black lines represent the best fit from a linear regression; gray dotted lines are 95% confidence intervals. In A–D, all of the recordings are from different preparations.
Fig. 6.
Fig. 6.
The time course of plasticity in spike-mediated synaptic transmission evoked by a step depolarization (simulated burst protocol) compared with the time course of changes in Ca fluorescence, under control conditions and in the presence of internal EGTA. Data are from the experiments illustrated in Figure 5. Changes in Ca florescence (ΔF/F) were measured in the main neurite and synaptic contact region corresponding to sites1 and 4 of Figure 1B. Postsynaptic responses were measured as smIPSPs (1) or smIPSCs (2).A, Comparison of spike-mediated postsynaptic responses (1,smIPSP; 2,smIPSC) and Ca fluorescence changes (ΔF/F) averaged across experiments under control conditions and in the presence of internal EGTA. B, Spike-mediated postsynaptic responses (smIPSP in 1 and smIPSC in2) and the change in the Ca fluorescence signal, averaged across experiments, are plotted versus the timing of the evoked spike from the start of the step depolarization under control conditions and in the presence of internal EGTA. A single exponential time constant was fitted to the rise of the postsynaptic responses (τIPSPIPSC) and the Ca fluorescence signal (τΔF/F) in1 and 2 in the main neurite (a) and the synaptic contact region (b) using ƒ(t) =Aieti+ C. Data presented here are fromA.
Fig. 7.
Fig. 7.
A, The time course of graded synaptic transmission (measured as gIPSC) evoked by a step depolarization (simulated burst protocol) compared with the time course of changes in Ca florescence, under control conditions and with internal EGTA. Data are averages from the experiments illustrated in Figure 5. In this and subsequent figures, gIPSCs were obtained by low-pass filtering of the total postsynaptic current at 1 Hz. Filtering at 1 Hz provided realistic extractions of the data without significant distortions in the time course or magnitude of the graded postsynaptic responses (comparisons were made with filtering at 3, 5, and 10 Hz) and eliminated all components of spike-mediated postsynaptic signals. Changes in Ca fluorescence (ΔF/F) were measured in the main neurite and synaptic contact region corresponding to sites1 and 4 of Figure 1B. ΔF/F was smoothed over seven points by an Origin 6.1 standard function, Adjacent Averaging, which calculates the smoothed value at index i as the average of the data points in the interval [i−(n−1)/2, i+(n−1)/2], inclusive. B, Superimposed time courses of average graded postsynaptic response (gIPSC) and average Ca fluorescence signal (ΔF/F) in the synaptic contact region under control conditions and in the presence of internal EGTA. Data are from A.
Fig. 8.
Fig. 8.
Photo-release of caged Ca2+elicits graded transmission and enhances spike-mediated transmission when spikes are evoked from a steady holding potential.A, Ca fluorescence images of the presynaptic cell before, during, and after photo-release of caged Ca2+ (top insets fromleft to right). The major panel shows a combination of the before and during image at a larger scale. The circles show zones in which Ca fluorescence was monitored; the circle labeled1 corresponds to the center of the releasing light beam, the circle labeled 2 shows the zone of photo-release as determined by the photo-release of caged fluorescein in the absence of a ganglion preparation, and the circlelabeled 3 is in the main neurite. In all photo-release experiments, similar monitoring and release zones were used.B, Synaptic transmission in the absence (1,Control) and during photo-release of caged Ca2+ (2,NP-EGTA) in the same preparation. C, Plots of the time course of spike-mediated (1,smIPSC) and graded synaptic transmission (2,gIPSC) in the absence (blue lines) and during photo-release of caged Ca2+ (red lines). The green bar shows the duration of the releasing light flash.
Fig. 9.
Fig. 9.
Photo-release of caged Ca2+elicits graded transmission and enhances spike-mediated transmission by spikes superimposed on a step depolarization (simulated burst protocol). A, Synaptic transmission in the absence (1,Control) and during photo-release of caged Ca2+ (2,NP-EGTA) in the same preparation. B, Plots of the time course of spike-mediated (1,smIPSC) and graded synaptic transmission (2,gIPSC) in the absence (black lines) and during photo-release of caged Ca2+ (gray lines). Thewhite bar shows the duration of the releasing light flash. Detectable smIPSCs elicited by the brief current pulses are indicated by asterisks (A). The first spike elicited by a current pulse during the step inA1 and A2 did not result in a detectable smIPSC; thus a zero value appears in the plots of B1where all responses to spikes elicited by pulses during the current step are plotted. The step depolarization itself elicited a spike in the control experiment (A1), but it elicited no detectable smIPSC response and was not plotted (B1).
Fig. 10.
Fig. 10.
Photo-release of caged Ca2+elicits graded transmission and enhances spike-mediated transmission by spikes superimposed on a step depolarization (simulated burst protocol). A, Synaptic transmission in the absence (1,Control) and during photo-release of caged Ca2+ (2, 3,NP-EGTA) in the same preparation. B, Plots of the time course of spike-mediated (smIPSC,gray lines) and graded synaptic transmission (gIPSC, black lines) in the absence (1,Control) and during two subsequent photo-releases of caged Ca2+(2, 3,NP-EGTA). The white bars show the duration of the releasing light flash. Only the smIPSCs elicited by the brief current pulses during the depolarizing step are plotted. Plots correspond to panels 1–3 inA.
Fig. 11.
Fig. 11.
Photo-release of caged Ca2+chelator suppresses graded transmission and alters the time course of plasticity in spike-mediated transmission by spikes superimposed on a step depolarization (simulated burst protocol). A,Synaptic transmission in the absence (1, 4,Control Pre-release and Control Post-release, respectively) and during two subsequent photo-releases of caged Ca2+ chelator (2, 3,Diazo-2) in the same preparation.B, Ca fluorescence images of the presynaptic cell before, during, and after photo-release of caged Ca2+ (left insets fromtop to bottom corresponding to the photo-release shown in A2). The major panel shows a combination of the before and during image at a larger scale. The circles show zones in which Ca fluorescence was monitored; the circle labeled1 corresponds to the center of the releasing light beam, the circle labeled 2 shows the zone of photo-release as determined by the photo-release of caged fluorescein in the absence of a ganglion preparation, and the circlelabeled 3 is in the main neurite.C, Plots of the time course of spike-mediated (smIPSP, blue and red lines for control and photo-release experiments, respectively) and graded synaptic transmission (gIPSP,black lines) in the absence (1,Control Pre-release; 4, Control Post-release) and during two subsequent photo-releases of caged Ca2+ chelator (2, 3,Diazo-2). The green bars show the duration of the releasing light flash. Only the smIPSCs elicited by the brief current pulses during the depolarizing step are connected bylines. Plots correspond to panels 1–4 ofA.

Similar articles

Cited by

References

    1. Adams SR, Tsien RY. Controlling cell chemistry with caged compounds. Annu Rev Physiol. 1993;55:755–784. - PubMed
    1. Angstadt JD, Calabrese RL. Calcium currents and graded synaptic transmission between heart interneurons of the leech. J Neurosci. 1991;11:746–759. - PMC - PubMed
    1. Atluri PP, Regehr WG. Determinants of the time course of facilitation at the granule cell to Purkinje cell synapse. J Neurosci. 1996;16:5661–5671. - PMC - PubMed
    1. Augustine GJ. How does calcium trigger neurotransmitter release? Curr Opin Neurobiol. 2001;11:320–326. - PubMed
    1. Augustine GJ, Adler EM, Charlton MP, Hans M, Swandulla D, Zipser K. Presynaptic calcium signals during neurotransmitter release: detection with fluorescent indicators and other calcium chelators. J Physiol (Paris) 1992;86:129–134. - PubMed

Publication types

MeSH terms

LinkOut - more resources