. 2003 Feb 15;23(4):1287-97.
doi: 10.1523/JNEUROSCI.23-04-01287.2003.

GTPase regulators and photoresponses in cones of the eastern chipmunk

Affiliations

GTPase regulators and photoresponses in cones of the eastern chipmunk

Xue Zhang et al. J Neurosci. .

Abstract

Vertebrate cone and rod photoreceptor cells use similar mechanisms to transduce light signals into electrical signals, but their responses to light differ in sensitivity and kinetics. To assess the role of G-protein GTP hydrolysis kinetics in mammalian cone photoresponses, we have characterized photoresponses and GTPase regulatory components of cones and rods from the cone-dominant retina of the eastern chipmunk. Sensitivity, based on the stimulus strength required for a half-maximum response, of the M-cone population was 38-fold lower than that of the rods. The relatively lower cone sensitivity could be attributed in part to lower amplification in the rising phase and in part to faster recovery kinetics. At a molecular level, cloning of chipmunk cDNA and expression of recombinant proteins provided standards for quantitative immunoblot analysis of proteins involved in GTPase acceleration. The ratio of the cGMP-phosphodiesterase inhibitory subunit gamma to cone pigment, 1:68, was similar to the levels observed for ratios to rhodopsin in bovine retina, 1:76, or mouse retina, 1:65. In contrast, the ratio to pigment of the GTPase-accelerating protein RGS9-1 was 1:62, more than 10 times higher than ratios observed in rod-dominant retinas. Immunoprecipitation experiments revealed that, in contrast to rods, RGS9-1 in chipmunk retina is associated with both the short and long isoforms of its partner subunit G(beta5). The much higher levels of the GTPase-accelerating protein complex in cones, compared with rods, suggest a role for GTPase acceleration in obtaining rapid photoresponse kinetics.


Figures

Fig. 1.
Fig. 1.
Immunofluorescence localization of RGS9-1 (A, B, D, E) and Gβ5 (C, F) in mouse (A–C) and chipmunk (D–F) retinas. IS, Inner segments; ONL, outer nuclear layer; OPL, outer plexiform layer. Scale bars, 10 μm. RGS9-1 and Gβ5 staining are shown in green. Mouse cone sheaths (peanut agglutinin staining; B) and chipmunk rods (rhodopsin staining; E, same section asD) are shown in red.Arrowheads indicate chipmunk rods inF.
Fig. 2.
Fig. 2.
Suction electrode recordings of the light-evoked currents from chipmunk rod and cone photoreceptors. A, Rods. A family of responses evoked by 2 msec flashes of light of increasing strength. Each trace represents the averaged response of 3–39 repeated stimuli (DC to 50 Hz, 37°C). The stimulus strength varied from 0.73 to 3.97 log-photons/μm2(or 5.4–9200 photons/μm2). On theright, the peak amplitude of each response is plotted against the log of the stimulus strength. The long thin lines between the left and right graphs connect selected data points with their respective photocurrent traces. The smooth curve is an exponential saturation function fit to the intensity response data (see Results). The short vertical bar near themiddle of the intensity graph indicates the mean value of I1/2 for 30 rods; theshort horizontal bar indicates ±1 SD. B, Cones. Left, Family of responses recorded from a cone; each trace is the average of 5–20 responses to stimuli whose strength ranged from 3.38 to 4.83 log-photons/μm2 (or 2410–67,200 photons/μm2; DC to 100 Hz, 36°C).Right, Intensity-versus-response plot for the cone data fit by an exponential saturation function. The short vertical bar near the middle of the intensity graph indicates the mean value ofI1/2 for 11 M-cones; the short horizontal bar indicates ±1 SD. C, Fitting of the equation of Lamb and Pugh (1992) (Equation 1) to responses of a typical rod, over the period from 0 to 85 msec after the flash. Photoisomerizations for the four traces were Φ = 1.5, 3.0, 5.6, and 11.1, and Rmax = 26 pA in this cell. Parameters obtained from the fit were gain, A = 11.3 sec−2; and delay,td = 7.6 msec. D, Fitting of the same equation to responses of a typical M-cone over the period from 0 to 52 msec after the flash. Photoisomerizations for the four traces were Φ = 61.9, 108, 176, and 319, and Rmax = 15 pA in this cell. Parameters obtained from the fit were gain, A = 1.7 sec−2; and delay,td = 9.8 msec.
Fig. 3.
Fig. 3.
Estimation of pigment content by difference spectrophotometry. A, Model absorbance spectra used for estimates. Relative spectral sensitivity data, determined from suction electrode current recordings as described in Results, are shown along with curves representing the model spectra fit to the data as described in Materials and Methods. Circles, M-cones;squares, rods; triangles, S-cones. Thesolid line labeled R* is a plot of measured absorbance data for bovine rhodopsin after illumination.B, Difference spectrum of detergent extract of chipmunk retina–RPE. Circles, Difference between absorbance before and after exposure to room light; line, fit of linear combination of model spectra to difference spectrum. Thecurve is the result predicted for a molar ratio of M pigment/rhodopsin/S pigment of 1:0.30:0.05 and a total cone pigment concentration of 0.60 μm.
Fig. 4.
Fig. 4.
Phylogenetic trees calculated from the amino acid sequences of RGS9 (A), Gβ5(B), and PDEγ (C) by the neighbor-joining method. The horizontal distances are proportional to the percent differences in amino acid sequences. Scale bar, 10% replacement of an amino acid per site.
Fig. 5.
Fig. 5.
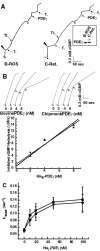
Biochemical properties of chipmunk cone PDE and PDEγ. A, pH recordings from chipmunk retina homogenate (C-Ret.) and bovine ROS (B-ROS) to test activity of bovine rod PDE and chipmunk cone PDE. Each sample contained 2 nm PDEγ, as estimated by immunoblots (inset) and densitometry. PDE was activated by removal of inhibitory subunit PDEγ using trypsin (T.). The hydrolysis of cGMP by PDE leads to a decrease in pH, shown as positive deflection on the y-axis. Inhibition of PDE was restored by addition of bovine recombinant PDEγ. Left, Activity of bovine PDE; right, activity of chipmunk PDE.TI, Soybean trypsin inhibitor. The long arrowheads indicate time 0, when bovine ROS or chipmunk retina homogenate was added, and short arrowheads indicate the addition of 2 mm cGMP. B, inhibition of PDE activity followed by pH recording. Top, At the indicated times, first trypsin-activated PDE and then indicated amounts of His6-tagged PDEγ (chipmunk cone or bovine rod) were added to a reaction vessel containing 2 mm cGMP. Hydrolytic velocity (d[cGMP]/dt) is proportional to the slope at each point along thetraces. Bottom, Inhibitory activities of bovine rod (triangles) and chipmunk cone PDEγ (squares) are plotted along with linear least squares fits of decreases in cGMP hydrolytic velocity (y-axis) as a function of added PDEγ. The inhibitory activities calculated from the slopes are 1773 ± 207 mol of cGMP hydrolysis per second inhibited per mole of bovine rod PDEγ and 1620 ± 275 mol of cGMP hydrolysis per second inhibited per mole of chipmunk cone PDEγ. C, stimulation of GAP activity. The first-order rate constants for GTP hydrolysis in bovine rod outer segment membranes measured under single-turnover conditions are plotted as a function of concentrations of added recombinant PDEγ from bovine rods (squares) or chipmunk cones (circles).
Fig. 6.
Fig. 6.
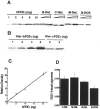
Determination of PDEγ levels by quantitative immunoblots. A, Examples of immunoblots used to create standard curves from PDEγ purified from bovine retina and to determine amounts in each sample. B-Ret., Bovine retinal extract; M-Ret., murine retinal extract;C-Ret., chipmunk retinal extract; B-ROS, bovine rod outer segment homogenate. B, Example of immunoblots used to calibrate relative sensitivity of anti-PDEγ for chipmunk cone PDEγ using purified his6-tagged recombinant proteins. C, Example of a standard curve for purified bovine PDEγ from the blot in A.D, Ratios of PDEγ to rhodopsin or cone pigment in chipmunk (C-ret.), mouse (M-ret.), and bovine (B-ret.) retinas and in bovine rod outer segments (B-ROS). The ratios are 0.0132 ± 0.007 in bovine retina, 0.0143 ± 0.0015 in chipmunk retina, 0.0155 ± 0.0028 in mouse retina, and 0.0096 ± 0.0016 in bovine ROS.
Fig. 7.
Fig. 7.
Determination of RGS9-1 levels by quantitative immunoblots. A, Examples of immunoblots used to generate standard curves and to determine amounts in each sample.B, Example of a standard curve for his6-RGS9-1 (bovine). C, D, Examples of immunoblots used to calibrate relative sensitivity of RGS9-1-specific antibodies for RGS9-1 from bovine (His6-bS9), chipmunk (His6-cS9), and mouse (His6-mS9).E, Ratios of RGS9-1 to rhodopsin or cone pigment in chipmunk retina (C-Ret.), 0.0157 ± 0.0016; mouse retina (M-Ret.), 0.0015 ± 0.0006; and bovine retina (B-Ret.), 0.0016 ± 0.0001; and in bovine rod outer segments (B-ROS), 0.0011 ± 0.0004.
Fig. 8.
Fig. 8.
Coimmunoprecipitation of both long and short isoforms of Gβ5 with RGS9-1 in chipmunk retina. RGS9-1 and associated proteins were immunoprecipitated with immobilized RGS9-1-specific antibodies as described in Materials and Methods. The immunoprecipitates were analyzed by SDS-PAGE and immunoblotting using antibodies specific for RGS9 (bottom panel) or Gβ5 (top panel; antibody recognizes a peptide epitope present in both isoforms). Theleft two lanes in each panel are total retinal homogenates from 50 μg of bovine retina (B-Ret.) or 10 μg of chipmunk retina (C-Ret.), and the right two lanes are the immunoprecipitates (IP; from 100 and 20 μg, respectively).

Similar articles

Cited by

References

    1. Angleson JK, Wensel TG. Enhancement of rod outer segment GTPase accelerating protein activity by the inhibitory subunit of cGMP phosphodiesterase. J Biol Chem. 1994;269:16290–16296. - PubMed
    1. Arshavsky VY, Lamb TD, Pugh EN., Jr G proteins and phototransduction. Annu Rev Physiol. 2002;64:153–187. - PubMed
    1. Babu KR, Dukkipati A, Birge RR, Knox BE. Regulation of phototransduction in short-wavelength cone visual pigments via the retinylidene Schiff base counterion. Biochemistry. 2001;40:13760–13766. - PubMed
    1. Baylor DA, Hodgkin AL. Detection and resolution of visual stimuli by turtle photoreceptors. J Physiol (Lond) 1973;234:163–198. - PMC - PubMed
    1. Baylor DA, Nunn BJ, Schnapf JL. The photocurrent, noise and spectral sensitivity of rods of the monkey Macaca fascicularis. J Physiol (Lond) 1984;357:575–607. - PMC - PubMed

Publication types

MeSH terms

Substances

LinkOut - more resources