

Induction of cyclooxygenase-2 in monocyte/macrophage by mucins secreted from colon cancer cells
- PMID: 12598658
- PMCID: PMC151410
- DOI: 10.1073/pnas.0435410100
Induction of cyclooxygenase-2 in monocyte/macrophage by mucins secreted from colon cancer cells
Abstract
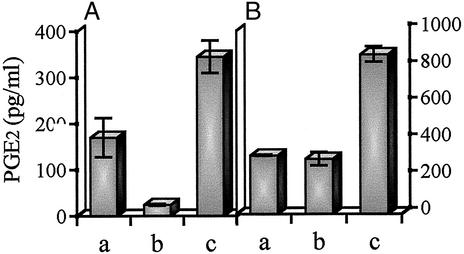
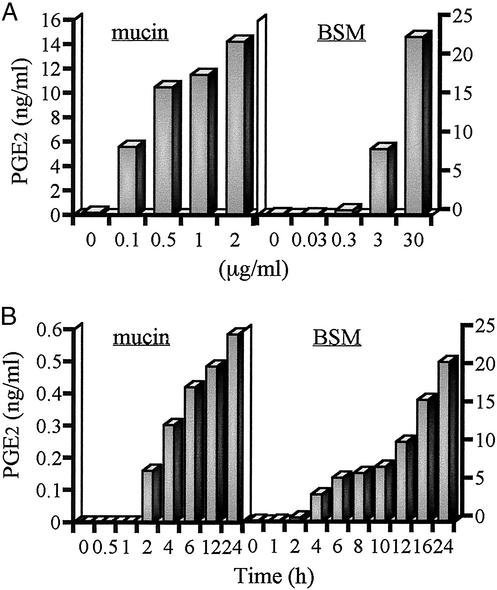
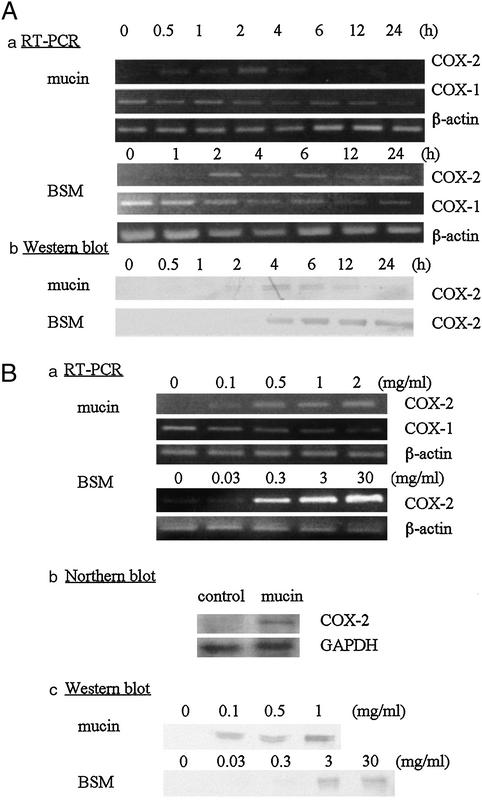
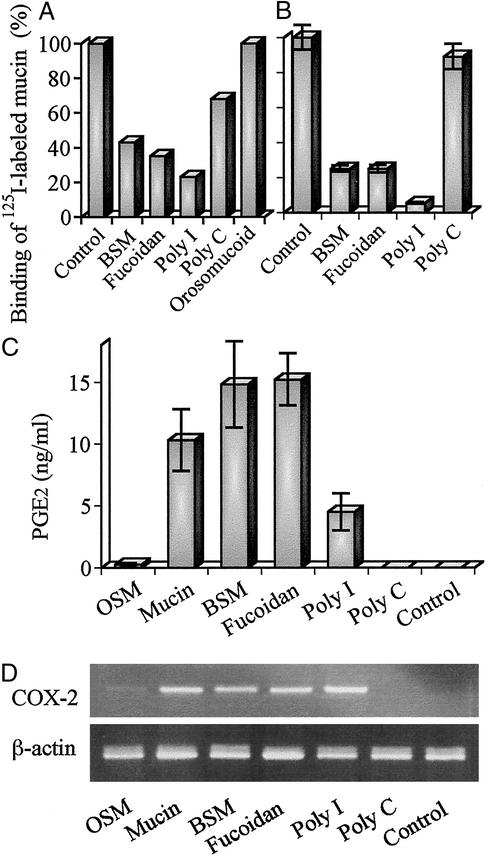
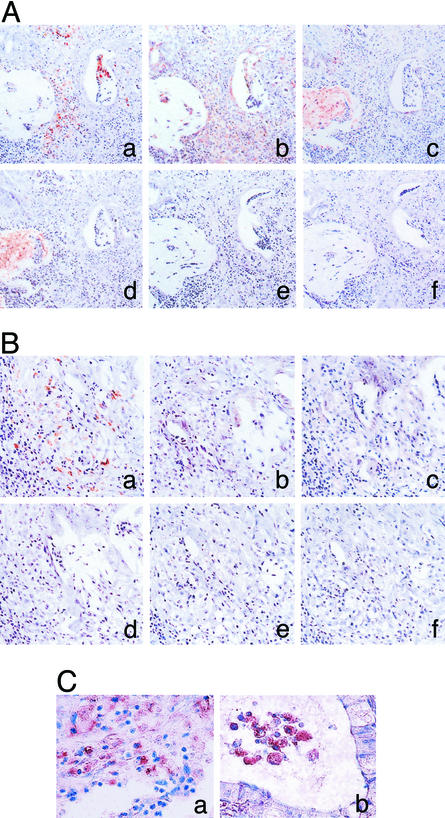
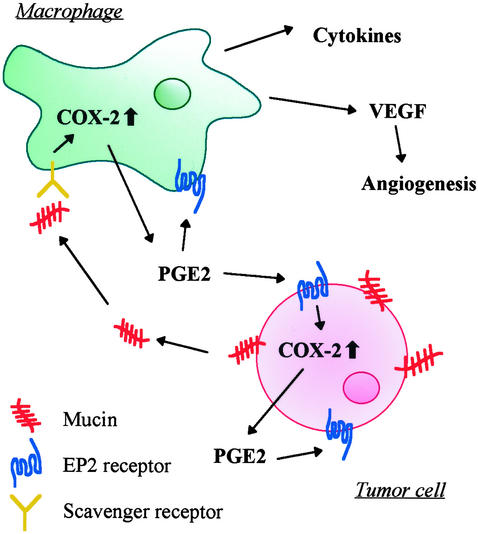
Up-regulation of cyclooxygenase-2 (COX-2) and overproduction of prostaglandins have been implicated in the initiation and/or progression of colon cancer. However, it is uncertain in which cells and how COX-2 is induced initially in the tumor microenvironment. We found that a conditioned medium of the colon cancer cell line, LS 180, contained a factor to induce COX-2 in human peripheral blood mononuclear cells. This factor was purified biochemically and revealed to be mucins. A small amount of mucins (approximately 100 ng of protein per ml) could elevate prostaglandin E2 production by monocytes. The mucins induced COX-2 mRNA and protein levels of monocytes in a dose- and time-dependent manner, indicating a COX-2-mediated pathway. We also have examined immunohistochemically the localization of COX-2 protein and mucins in human colorectal cancer tissues. It is noteworthy that COX-2-expressing macrophages were located around the region in which mucins were detectable, suggesting that COX-2 also was induced by mucins in vivo. These results suggest that mucins produced by colon cancer cells play a critical role in the initial induction of COX-2 in the tumor microenvironment.
Figures

Similar articles
-
Prostaglandin E2 induces hypoxia-inducible factor-1alpha stabilization and nuclear localization in a human prostate cancer cell line.J Biol Chem. 2002 Dec 20;277(51):50081-6. doi: 10.1074/jbc.M201095200. Epub 2002 Oct 24. J Biol Chem. 2002. PMID: 12401798
-
High expression of cyclooxygenase-2 in macrophages of human colonic adenoma.Int J Cancer. 1999 Nov 12;83(4):470-5. doi: 10.1002/(sici)1097-0215(19991112)83:4<470::aid-ijc6>3.0.co;2-f. Int J Cancer. 1999. PMID: 10508481
-
Effects of Tripterygium wilfordii hook F extracts on induction of cyclooxygenase 2 activity and prostaglandin E2 production.Arthritis Rheum. 1998 Jan;41(1):130-8. doi: 10.1002/1529-0131(199801)41:1<130::AID-ART16>3.0.CO;2-4. Arthritis Rheum. 1998. PMID: 9433878
-
Cyclo-oxygenases and prostaglandins in acute inflammatory demyelination of the peripheral nerve.Neurology. 2003 Dec 23;61(12):1774-9. doi: 10.1212/01.wnl.0000098884.75756.4d. Neurology. 2003. PMID: 14694045
-
Cyclooxygenase-2 activation mediates the proangiogenic effect of nitric oxide in colorectal cancer.Clin Cancer Res. 2004 Apr 15;10(8):2694-704. doi: 10.1158/1078-0432.ccr-03-0192. Clin Cancer Res. 2004. PMID: 15102673
Cited by
-
Underlying Mechanisms of Thrombosis Associated with Cancer and Anticancer Therapies.Curr Treat Options Oncol. 2024 Jul;25(7):897-913. doi: 10.1007/s11864-024-01210-7. Epub 2024 Jun 12. Curr Treat Options Oncol. 2024. PMID: 38862694 Review.
-
Dendritic Cell Vaccination of Glioblastoma: Road to Success or Dead End.Front Immunol. 2021 Nov 2;12:770390. doi: 10.3389/fimmu.2021.770390. eCollection 2021. Front Immunol. 2021. PMID: 34795675 Free PMC article. Review.
-
Effect of astragaloside IV on diabetic gastric mucosa in vivo and in vitro.Am J Transl Res. 2017 Nov 15;9(11):4902-4913. eCollection 2017. Am J Transl Res. 2017. PMID: 29218088 Free PMC article.
-
MUC4 is increased in high grade intraepithelial neoplasia in Barrett's oesophagus and is associated with a proapoptotic Bax to Bcl-2 ratio.J Clin Pathol. 2004 Dec;57(12):1267-72. doi: 10.1136/jcp.2004.017020. J Clin Pathol. 2004. PMID: 15563666 Free PMC article.
-
A digest on the role of the tumor microenvironment in gastrointestinal cancers.Cancer Microenviron. 2010 Mar 7;3(1):167-76. doi: 10.1007/s12307-010-0040-9. Cancer Microenviron. 2010. PMID: 21209782 Free PMC article.
References
-
- DuBois R N, Giardiello F M, Smalley W E. Gastroenterol Clin North Am. 1996;25:773–791. - PubMed
-
- Giardiello F M, Hamilton S R, Krush A J, Piantadosi S, Hylind L M, Celano P, Booker S V, Robinson C R, Offerhaus G J. N Engl J Med. 1993;328:1313–1316. - PubMed
-
- Marnett L J. Cancer Res. 1992;52:5575–5589. - PubMed
-
- Smith L L, Garavito M, DoWitt D L. J Biol Chem. 1996;271:33157–33160. - PubMed
-
- Eberhart C E, DuBois R N. Gastroenterology. 1995;109:285–301. - PubMed
Publication types
MeSH terms
Substances
LinkOut - more resources
Full Text Sources
Other Literature Sources
Research Materials
