. 2003 Mar;121(3):199-214.
doi: 10.1085/jgp.20028723.

Common molecular determinants of flecainide and lidocaine block of heart Na+ channels: evidence from experiments with neutral and quaternary flecainide analogues

Affiliations

Common molecular determinants of flecainide and lidocaine block of heart Na+ channels: evidence from experiments with neutral and quaternary flecainide analogues

Huajun Liu et al. J Gen Physiol. 2003 Mar.

Abstract

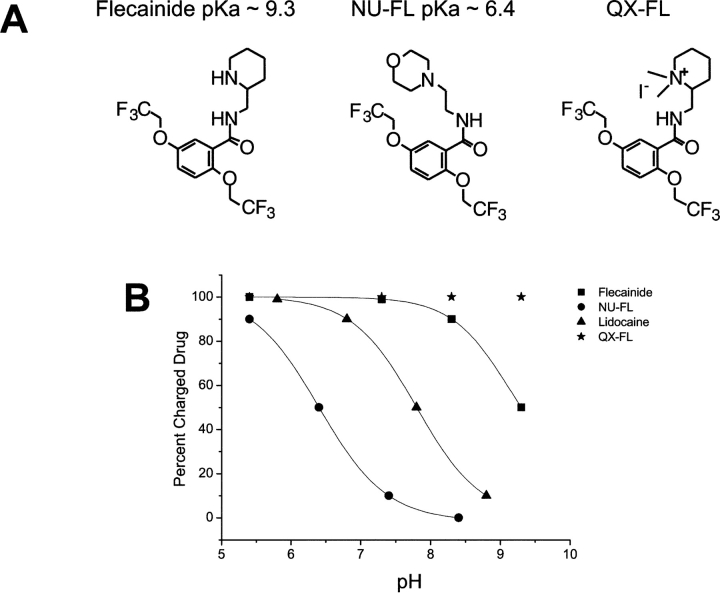
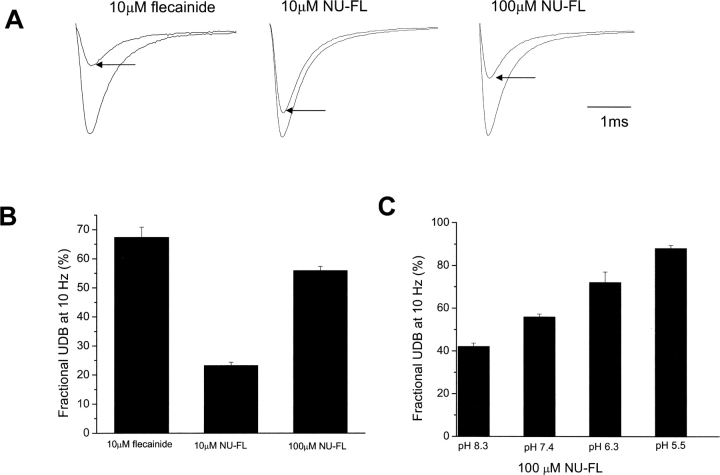
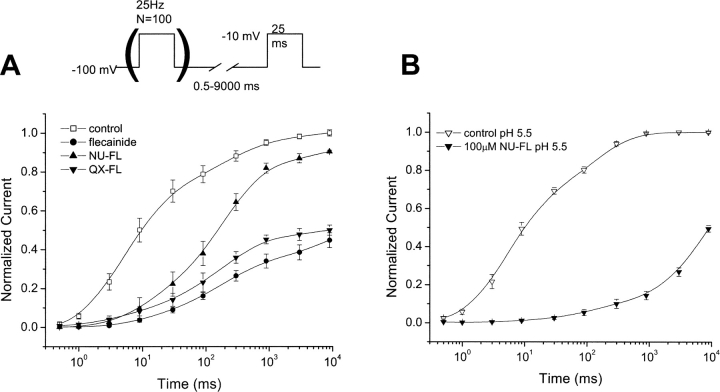
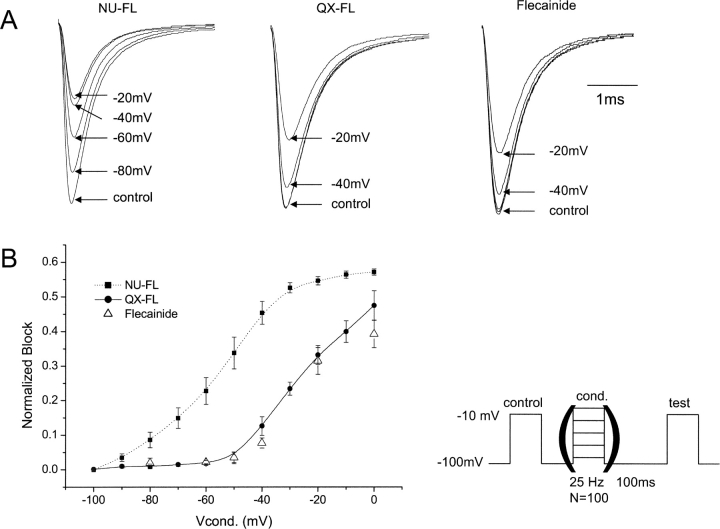
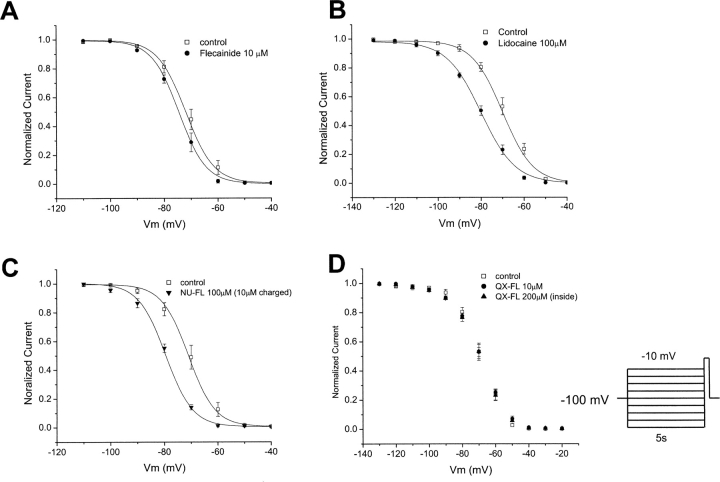
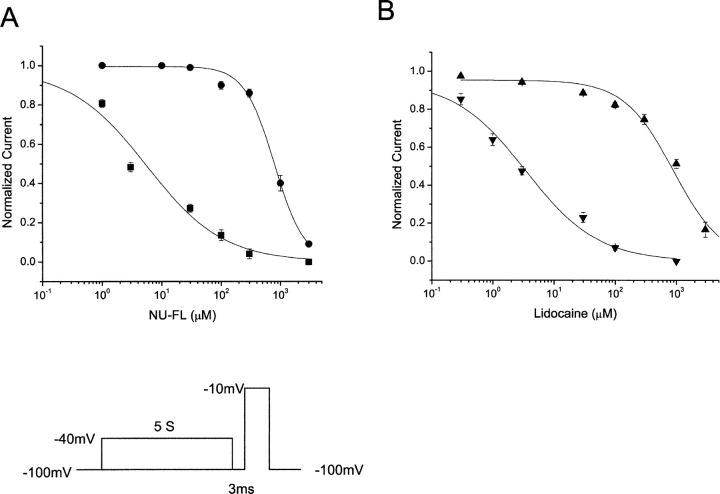
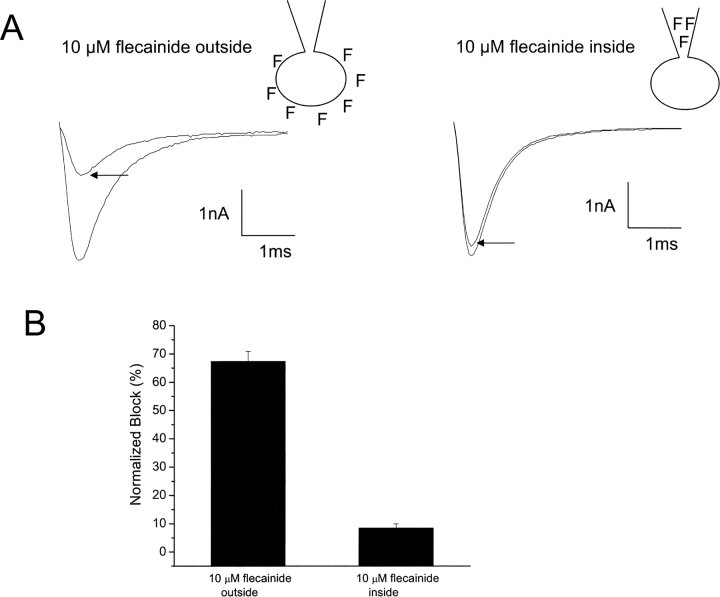
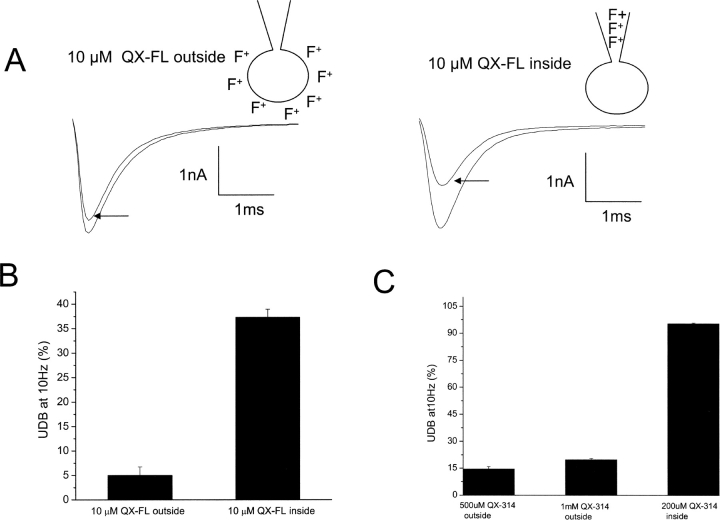
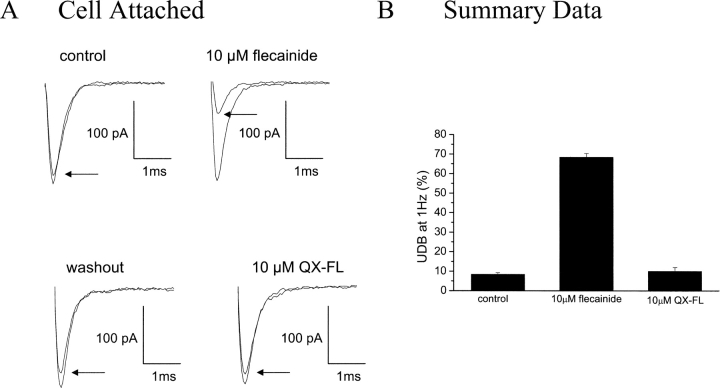
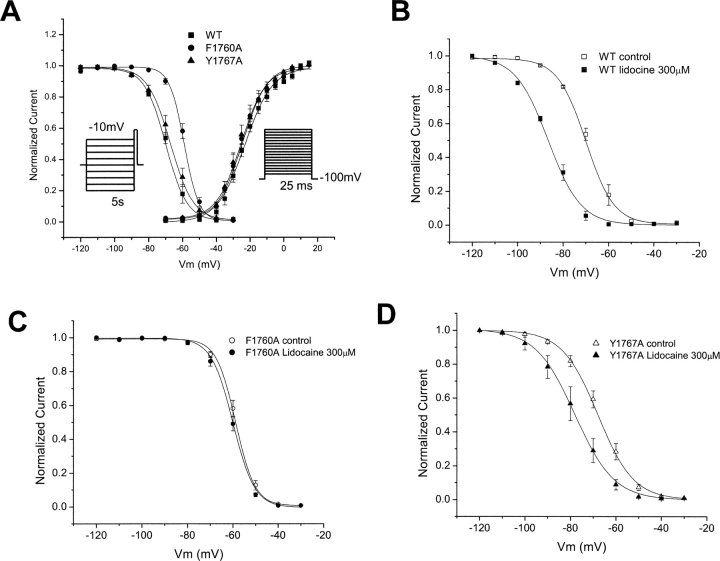
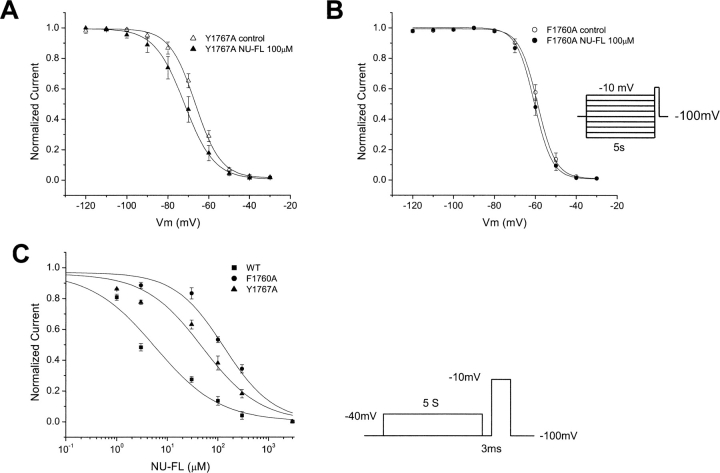
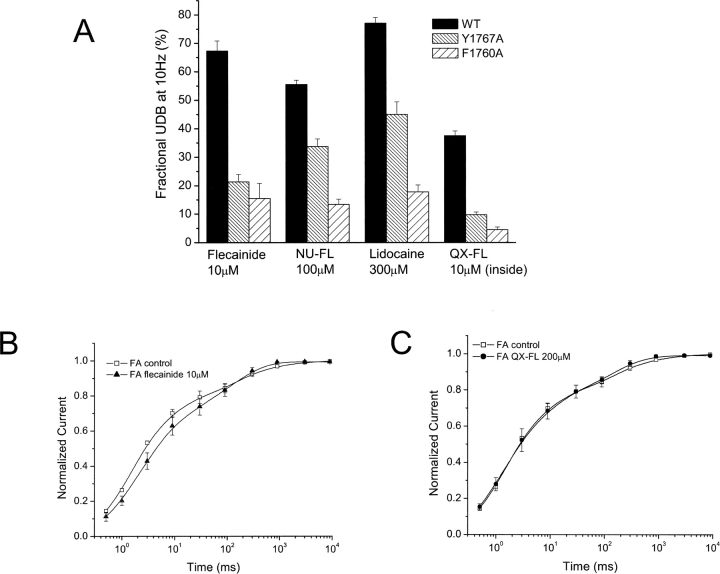
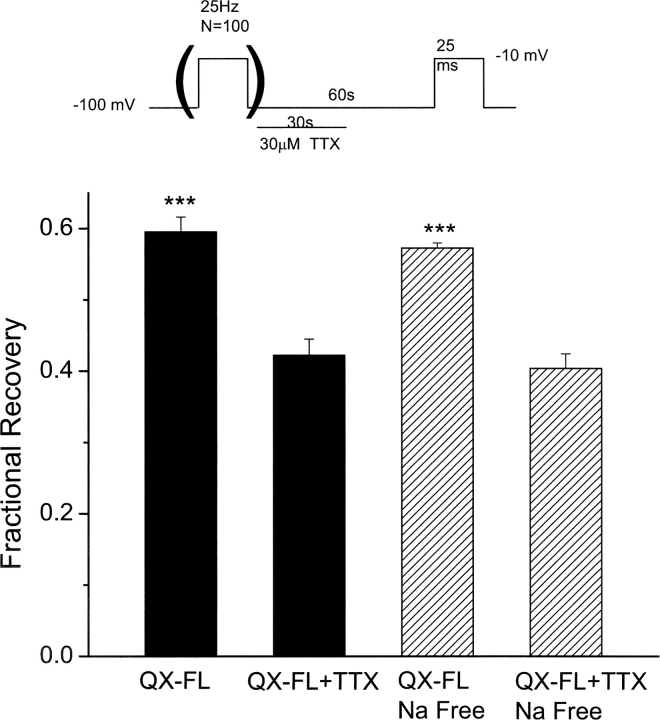
Flecainide (pKa 9.3, 99% charged at pH 7.4) and lidocaine (pKa 7.6-8.0, approximately 50% neutral at pH 7.4) have similar structures but markedly different effects on Na(+) channel activity. Both drugs cause well-characterized use-dependent block (UDB) of Na(+) channels due to stabilization of the inactivated state, but flecainide requires that channels first open before block develops, whereas lidocaine is believed to bind directly to the inactivated state. To test whether the charge on flecainide might determine its state specificity of Na(+) channel blockade, we developed two flecainide analogues, NU-FL (pKa 6.4), that is 90% neutral at pH 7.4, and a quaternary flecainide analogue, QX-FL, that is fully charged at physiological pH. We examined the effects of flecainide, NU-FL, QX-FL, and lidocaine on human cardiac Na(+) channels expressed in human embryonic kidney (HEK) 293 cells. At physiological pH, NU-FL, like lidocaine but not flecainide, interacts preferentially with inactivated channels without prerequisite channel opening, and causes minimal UDB. We find that UDB develops predominantly by the charged form of flecainide as evidenced by investigation of QX-FL at physiological pH and NU-FL investigated over a more acidic pH range where its charged fraction is increased. QX-FL is a potent blocker of channels when applied from inside the cell, but acts very weakly with external application. UDB by QX-FL, like flecainide, develops only after channels open. Once blocked, channels recover very slowly from QX-FL block, apparently without requisite channel opening. Our data strongly suggest that it is the difference in degree of ionization (pKa) between lidocaine and flecainide, rather than gross structural features, that determines distinction in block of cardiac Na(+) channels. The data also suggest that the two drugs share a common receptor but, consistent with the modulated receptor hypothesis, reach this receptor by distinct routes dictated by the degree of ionization of the drug molecules.


Figures

F<sc>igure</sc> 1.
Figure 1.
NU-Fl and QX-FL are novel analogues of flecainide. (A) Structural comparison of flecainide and its novel analogues NU-FL (center) and QX-FL (right). (B) Plot of estimated concentrations of charged drugs as function of pH. The pKa values of each compound are 9.3 for flecainide (▪), 6.4 for NU-FL (•), 7.8 for lidocaine (▴). At relevant physiological pH values flecainide is >99% charged, QX-FL (★) is fully ionized, lidocaine is ∼50:50, and NU-FL is >90% neutral.
F<sc>igure</sc> 2.
Figure 2.
UDB of WT Na+ channels by flecainide and NU-FL. Currents were evoked by imposing conditioning trains of 100–600 pulses (−10 mV, 25 ms) from a holding potential of −100 mV at a frequency of 10 Hz. Pulses were applied until steady-state UDB was achieved. This pulse protocol allows for a 75-ms interpulse interval at the holding potential between conditioning pulses. (A) Examples of current traces recorded at 10 Hz before and after steady-state UDB (arrows) by flecainide (10 μM), NU-FL (10 μM), and NU-FL (100 μM). Currents are superimposed records of first and last (∼300th) pulse of a conditioning train. (B) Bar graphs summarize steady-state UDB by flecainide and NU-FL, plotted as the fraction of current blocked in response to pulse trains (n = 4–6 cells per condition). (C) Percent UDB plotted vs. pH in the presence of 100 μM NU-FL (n = 4–6 cells per condition).
F<sc>igure</sc> 3.
Figure 3.
Recovery from UDB by flecainide, QX-FL, and NU-FL. UDB was induced by trains of 100 pulses (−10 mV, 25 ms, 25 Hz) from a −100 mV holding potential. Test pulses were then imposed after variable recovery intervals at −100 mV. Currents were normalized to steady-state current levels during slow pacing (once every 30 s) and plotted against recovery interval in the absence and presence of flecainide (10 μM) and NU-FL (100 μM), and NU-FL (pH 5.5, 100 μM). Recovery from UDB by QX-FL, flecainide, and NU-FL. UDB was induced by trains of 100 pulses (−10 mV, 25 ms, 25 Hz) from a −100 mV holding potential. Test pulses were then imposed after variable recovery intervals at −100 mV. Currents were normalized to steady-state current levels during slow pacing (once every 30 s) and plotted against recovery interval in the absence and presence of test drugs. (A) Drugs studied at pH 7.4 were flecainide (10 μM), NU-FL (100 μM), and QX-FL (internal, 200 μM). (B) Similar protocols were performed in solutions buffered to pH 5.5 in the absence and presence of NU-FL (100 μM). The averaged data were fitted with a two exponential function: y(t) = y0 + A1 × exp-t/τ1 + A2 × exp-t/τ2), where t is the recovery time, τ1 and τ2 are the recovery time constant, A1 and A2 are fractional amplitudes of each component, and y0 is the estimated steady-state fraction of recovered current. n = 3–5 cells per condition.
F<sc>igure</sc> 4.
Figure 4.
Voltage dependence of UDB of Na+ channels by flecainide, QX-FL, and NU-FL. Currents were recorded before (control) and after (test) application of conditioning pulses (100 pulses, 25 Hz) of varying amplitude in the presence of flecainide (10 μM), QX-FL (100 μM, internal), and NU-FL (100 μM). The pulse protocol allows for a 15-ms interpulse interval at the holding potential during the conditioning trains. Test pulses were preceded by a 100 ms pulse-free interval at the holding potential (−100 mV) to allow drug-free channels to recover from inactivation. (A) Current traces from experiments with flecainide (right), QX-FL (middle), and NU-FL (left) elicited by a control depolarization before and by test depolarization after conditioning trains to −80 mV∼0 mV. (B) Normalized block is plotted vs. conditioning pulse amplitude for NU-FL (▪), QX-FL (•), and flecainide (▵). Normalized block was determined as the fraction of test pulse current (normalized to control current) reduced by the conditioning train (n = 3–4 cells per measurement).
F<sc>igure</sc> 5.
Figure 5.
Effects of flecainide, NU-FL, and lidocaine on steady-state inactivation of WT Na+ channels. Steady-state inactivation was measured with 5-s conditioning pulses followed by a test pulse (−10 mV) with an interpulse of 10 s. Graphs show normalized current plotted against conditioning pulse voltage. Smooth lines are according to 1/{1 + exp[(Vc − V1/2)/k]}, where Vc is conditioning potential, V1/2 is voltage for which half the channel are not available, and k is a slope factor. The drug-induced shift in channel availability (ΔV1/2) was determined from V1/2,drug − V1/2,control using V1/2 values obtained from fits of the data. ΔV1/2 is −2.3 ± 0.29 mV with 10 μM flecainide, −9.17 ± 1.04 mV with 100 μM NU-FL, −10.28 ± 0.61 mV with 100 μM lidocaine (n = 4–6 cells per condition).
F<sc>igure</sc> 6.
Figure 6.
Affinity of resting and inactivated states of WT Na+ channels for NU-FL and lidocaine. The block of resting Na+ channels was investigated by depolarizing to −10 mV from a holding potential of −100 mV. The block of inactivated Na+ channels was measured using 5-s depolarizing prepulse to −40 mV to inactivated most channels and the membrane potential then was returned to the holding potential for 3 ms to allow drug-free channels to recover from inactivation. A test pulse to −10 mV then was applied. The block of peak test pulse current is plotted as a function of drug concentration. The smooth curves are the best fits of the Hill equation 1/((1 + ([drug]/EC50)n) to the data, these gave estimates of EC50 for drug binding to resting and inactivated channels. For the resting channels, EC50 are 794 ± 39.3 μM for NU-FL (•) and 895 ± 55.4 μM for lidocaine (▴). For the inactivated channels, EC50 are 5.32 ± 0.51 μM for NU-FL (▪) and 3.46 ± 0.33 μM for lidocaine (▾) (n = 3–5 cells per condition).
F<sc>igure</sc> 7.
Figure 7.
Test of sidedness of flecainide block using whole-cell recordings. (A) UDB of WT Na+ channels by external and internal application of flecainide in whole-cell configurations. Currents were evoked by imposing conditioning trains of 100–600 pulses (−10 mV, 25 ms) from a holding potential of −100 mV at a frequency of 10 Hz. Pulses were applied until steady-state UDB was achieved, as indicated by the arrows. (B) Bar graphs summarize steady-state UDB by external and internal application of flecainide (10 μM) plotted as the fraction of current blocked in response to pulse trains. n = 4–6 cells per condition.
F<sc>igure</sc> 8.
Figure 8.
Internally applied QX-FL blocks whole-cell Na+ channel activity. (A) UDB of WT Na+ channels by external and internal application of QX-FL in whole-cell configurations. Currents were evoked by imposing conditioning trains of 100–600 pulses (−10 mV, 25 ms) from a holding potential of −100 mV at a frequency of 10 Hz. Pulses were applied until steady-state UDB was achieved. (B) Bar graphs summarize steady-state UDB by external and internal application of QX-FL (10 μM) plotted as the fraction of current blocked in response to pulse trains. n = 4–6 cells per condition. (C) Bar graphs summarize steady-state UDB by external and internal application of QX-314 plotted as the fraction of current blocked in response to pulse trains. n = 4–6 cells per condition.
F<sc>igure</sc> 9.
Figure 9.
Cell-attached recordings reveal flecainide access to LA-receptor through the cell membrane. (A) UDB of WT Na+ channels by external application of flecainide and QX-FL in cell-attached configurations. Currents were evoked by imposing conditioning trains of 100–200 pulses (−20 mV, 25 ms) from a holding potential of −120 mV at a frequency of 1 Hz. Pulses were applied until steady-state UDB was achieved. (B) Bar graphs summarize steady-state UDB by external application of flecainide and QX-FL plotted as the fraction of current blocked in response to pulse trains. n = 2–3 cells per condition.
F<sc>igure</sc> 10.
Figure 10.
Effects of mutations of key residues of LA-receptor on Na+ channel gating and lidocaine block. (A) Averaged inactivation and activation curves for WT, F1760A, and Y1767A Na+ channels. The voltage-dependence for the inactivation was measured as described in Fig. 5. The voltage dependence of activation was measured by normalizing currents measured during pulses (25 ms) from −80 mV to 50 mV (5-mV increments) to driving force. Experimental data were fitted with Boltzmann relationships (Fig. 5) to obtain the parameters that follow. For inactivation: V1/2 (mV) = −69.2 ± 0.79 (WT); −60.6 ± 0.51 (F1760A); and −67.5 ± 0.63 (Y1767A). The slope factor, VK is 6.46 ± 0.36 (WT); 5.41 ± 0.18 (F1760A); 6.74 ± 0.33 (Y1767A). For activation: V1/2 (mV) is −25.3 ± 1.2 (WT); −23.3 ± 1.4 (F1760A); and −23.8 ± 1.3 (Y1767A). The slope factor, VK, is 7.1 ± 0.9 (WT); 7.2 ± 0.7 (F1760A); and 7.4 ± 0.6 (Y1767A). n = 4–6 cells per condition. (B–D) Mutations hhF1760A and hhY1767A reduce block of inactivated Na+ channel for lidocaine. Steady-state inactivation was measured as described in Fig. 5. Experimental data were fitted with Boltzmann relationships (Fig. 5) and the drug-induced shift in channel availability (ΔV1/2) was determined from V1/2,drug − V1/2,control using V1/2 values obtained from fits of the data. For WT, F1760A, and Y1767A, ΔV1/2 (mV) is −17.65 ± 1.17, −1.1 ± 0.30, and −9.67 ± 0.65 with 300 μM lidocaine, respectively (n = 4–6 cells per condition).
F<sc>igure</sc> 11.
Figure 11.
Effects of mutations of LA-receptor on NU-FL block. (A and B) Mutations F1760A and Y1767A reduce block of inactivated Na+ channel for NU-FL. Steady-state inactivation was measured as described in Fig. 5. Experimental data were fitted with Boltzmann relationships (Fig. 5). The drug-induced shift in channel availability (ΔV1/2) was determined from V1/2,drug − V1/2,control using V1/2 values obtained from fits of the data. For WT, F1760A, and Y1767A, ΔV1/2 (mV) is −9.17 ± 1.04, −1.57 ± 0.15, and −4.65 ± 0.57 with 100 μM NU-FL, respectively. n = 3–5 cells per condition. (C) Mutation F1760A and Y1767A reduce the affinity of inactivated channel for NU-FL. The block of inactivated Na+ channels was measured as described in Fig. 6. Experimental data were fitted with the Hill equation; these gave estimates of EC50 for NU-FL binding to the inactivated channels. For WT, F1760A, and Y1767A, EC50 for NU-FL are 5.32 ± 0.51 μM, 134.9 ± 9.96 μM, and 53.7 ± 5.55 μM, respectively (n = 3–5 cells per condition).
F<sc>igure</sc> 12.
Figure 12.
UDB of WT and mutant Na+ channels by flecainide, NU-FL, QX-FL, and lidocaine. (A) Currents were evoked by imposing conditioning trains of 100–600 pulses (−10 mV, 25 ms) from a holding potential of −100 mV at a frequency of 10 Hz. Pulses were applied until steady-state UDB was achieved. Bar graphs summarize steady-state UDB by flecainide (10 μM), NU-FL (100 μM), QX-FL (100 μM, internal), and lidocaine (300 μM) plotted as the fraction of current blocked in response to pulse trains. (B) Recovery of F1760A channels from drug block, measured as described in Fig. 3 legend, for flecainide (10 μM, left) and QX-FL (100 μM, internal, right).
F<sc>igure</sc> 13.
Figure 13.
Outer pore block by TTX impedes recovery from QX-FL block. WT channels were blocked by QX-FL (100 μM, internal application). UDB was induced by trains of 100 pulses (−10 mV, 25 ms, 25 Hz) from a −100 mV holding potential. Test pulses were then imposed after 60-s intervals at −100 mV to assay recovery from block. The protocol was performed in the absence and then in the presence of TTX (30 μM) during the first 30 s of the 60-s recovery period (see schematic). The bars graphs summarize the fraction of recovery from QX-FL block in the absence and presence of TTX in external solutions containing 130 mM NaCl. The hatched bars summarize similar experiments recorded in Na-free conditions (Na+ was replaced by n-methyl-glucamine). n = 4–6 cells per condition. ***, P < 0.05 compared with TTX-free conditions in both Na+ -containing and Na+-free solutions.

References

    1. Abriel, H., C. Cabo, X.H. Wehrens, I. Rivolta, H.K. Motoike, M. Memmi, C. Napolitano, S.G. Priori, and R.S. Kass. 2001. Novel arrhythmogenic mechanism revealed by a long-qt syndrome mutation in the cardiac na(+) channel. Circ. Res. 88:740–745. - PubMed
    1. An, R.H., R. Bangalore, S.Z. Rosero, and R.S. Kass. 1996. Lidocaine block of LQT-3 mutant human Na+ channels. Circ. Res. 79:103–108. - PubMed
    1. Anno, T., and L.M. Hondeghem. 1990. Interactions of flecainide with guinea pig cardiac sodium channels. Importance of activation unblocking to the voltage dependence of recovery. Circ. Res. 66:789–803. - PubMed
    1. Banitt, E.H., W.E. Coyne, J.R. Schmid, and A. Mendel. 1975. Antiarrhythmics. N-(aminoalkylene)trifluoroethoxybenzamides and N-(aminoalkylene)trifluoroethoxynaphthamides. J. Med. Chem. 18:1130–1134. - PubMed
    1. Benhorin, J., R. Taub, M. Goldmit, B. Kerem, R.S. Kass, I. Windman, and A. Medina. 2000. Effects of flecainide in patients with new SCN5A mutation: mutation- specific therapy for long-QT syndrome? Circulation. 101:1698–1706. - PubMed

Publication types

MeSH terms