. 2003 Mar;43(6):617-27.
doi: 10.1016/s0042-6989(03)00009-9.

Senescence of the temporal impulse response to a luminous pulse

Affiliations

Senescence of the temporal impulse response to a luminous pulse

Keizo Shinomori et al. Vision Res. 2003 Mar.

Abstract

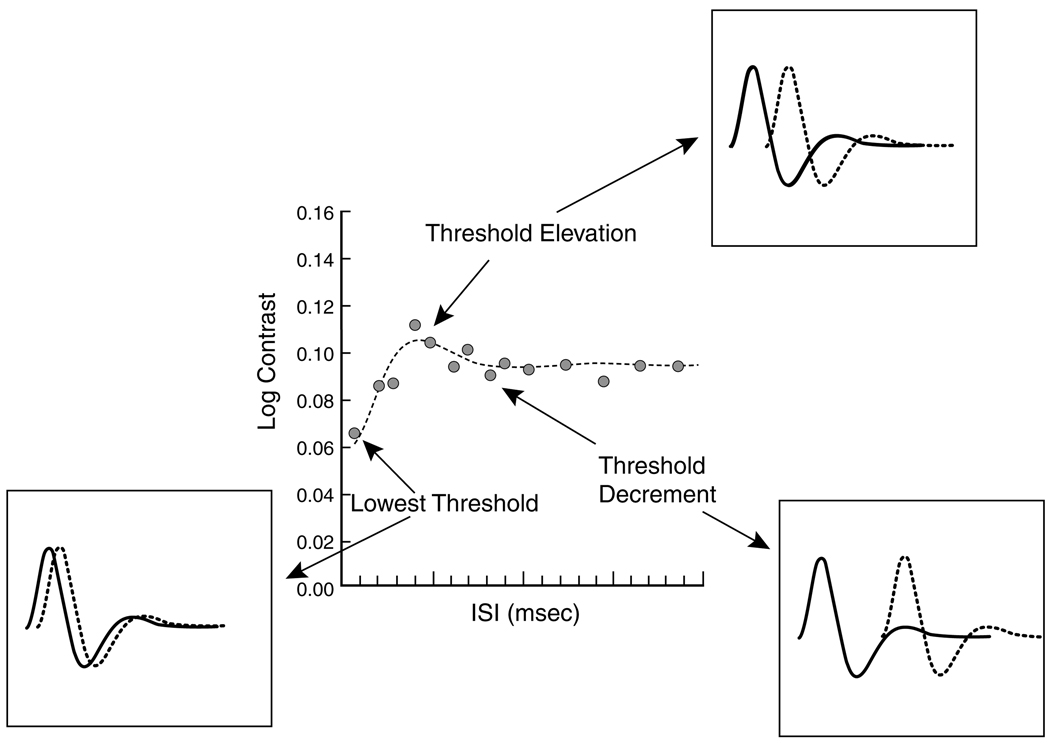
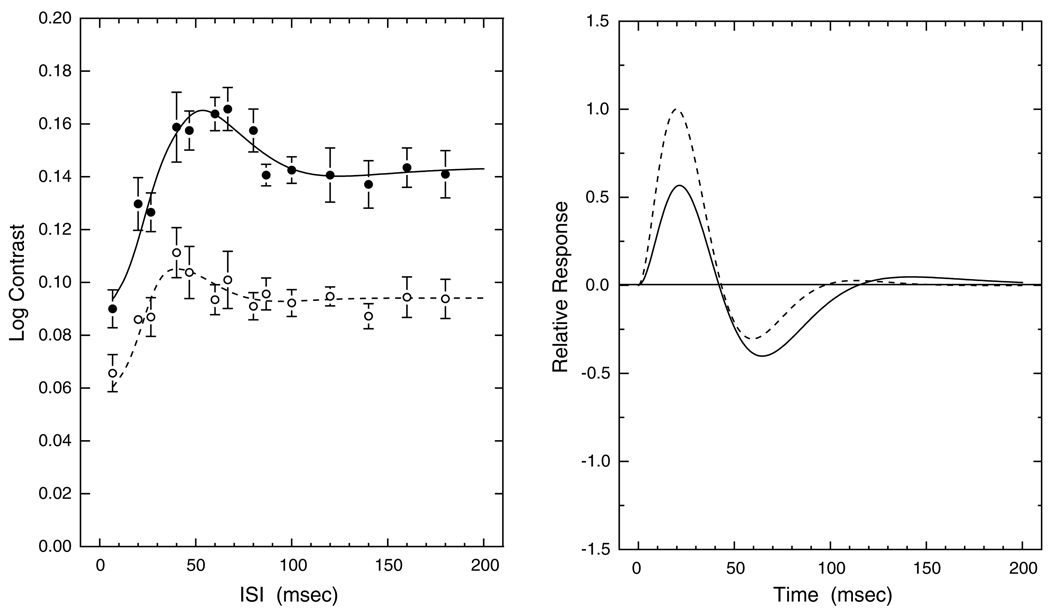
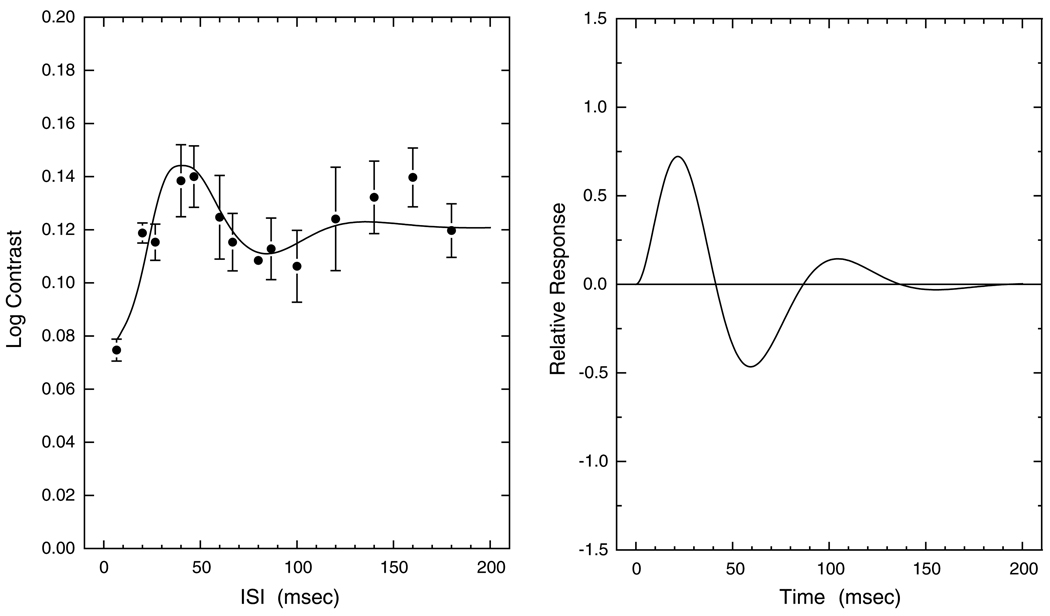
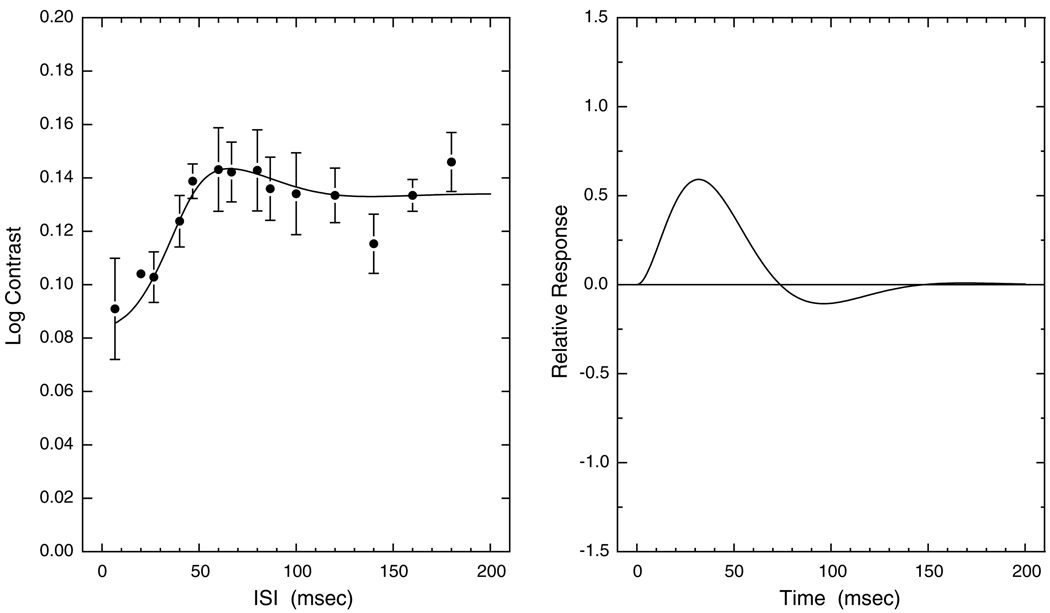
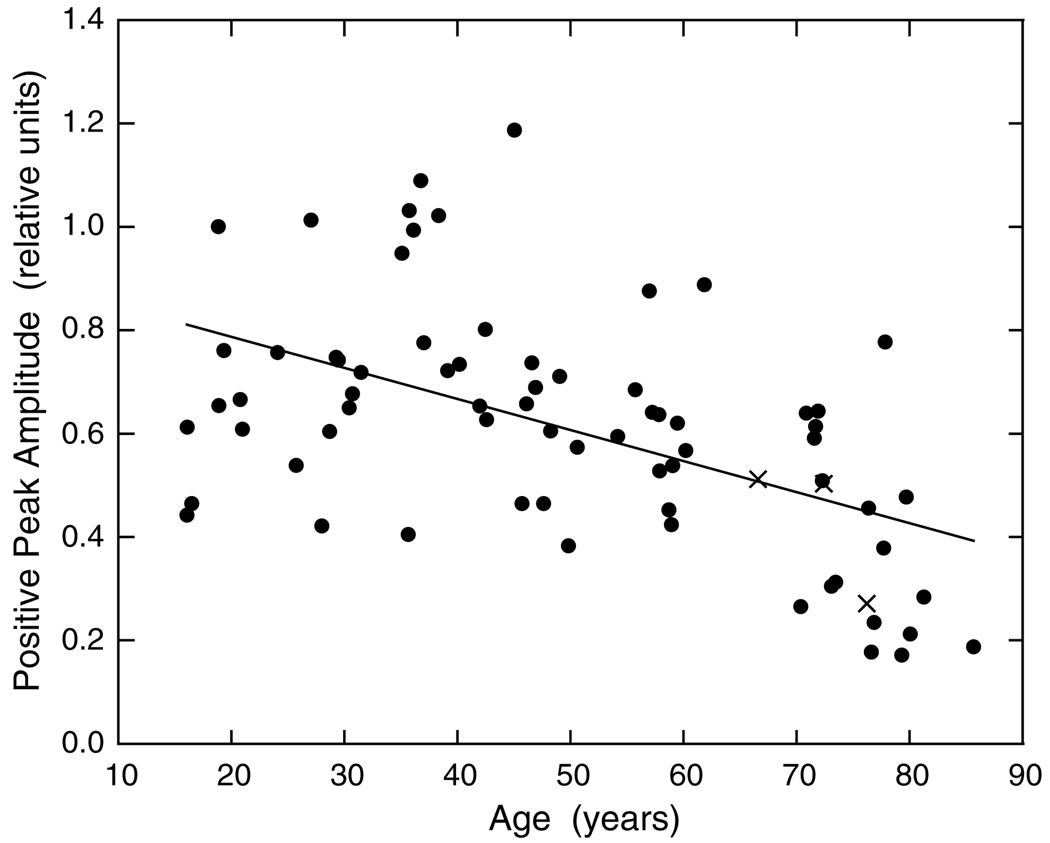
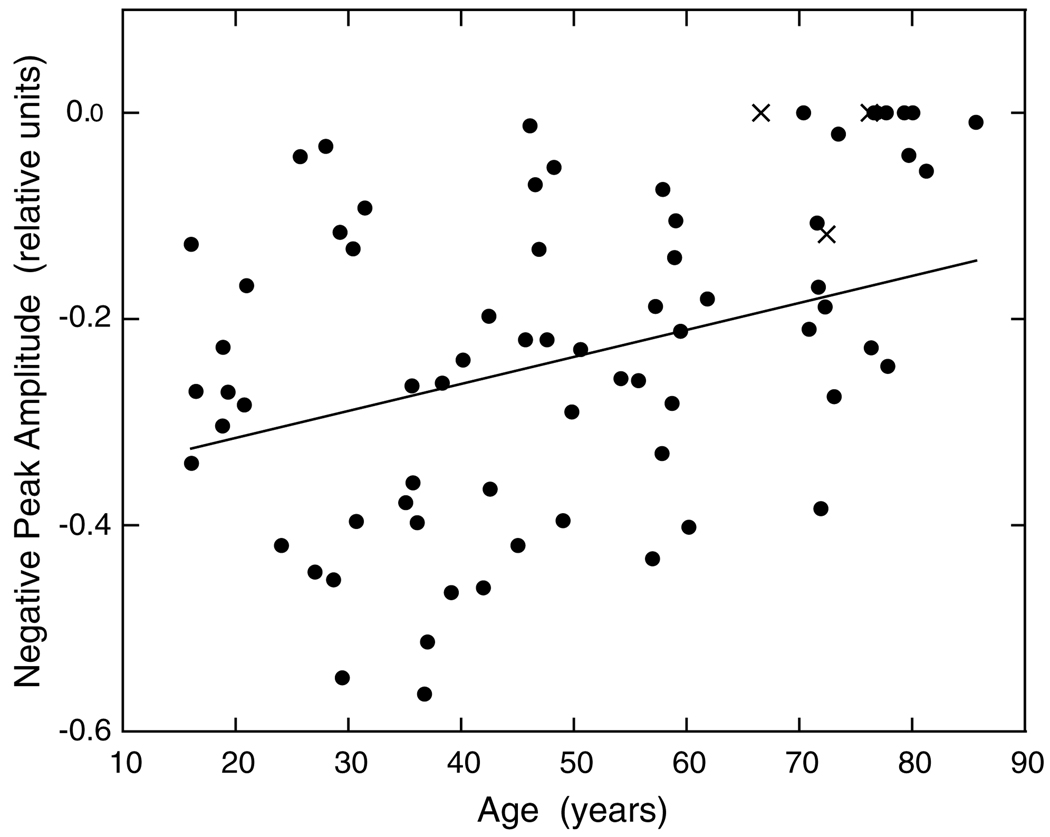
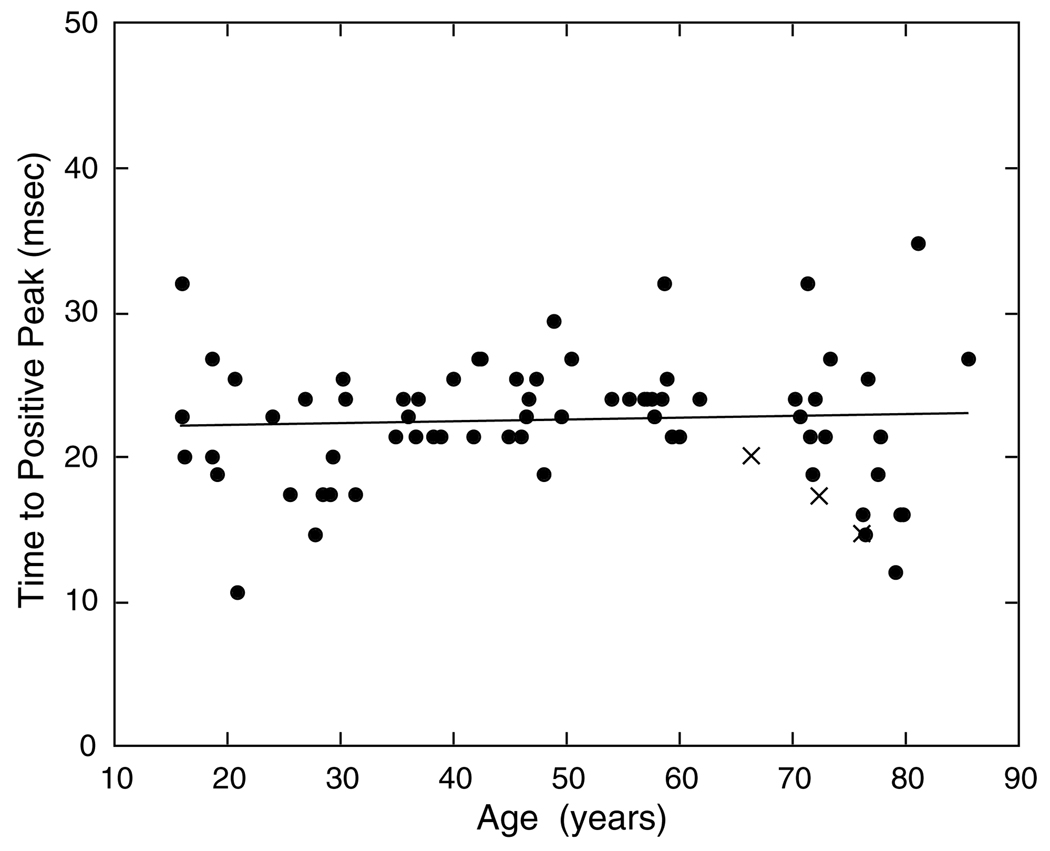
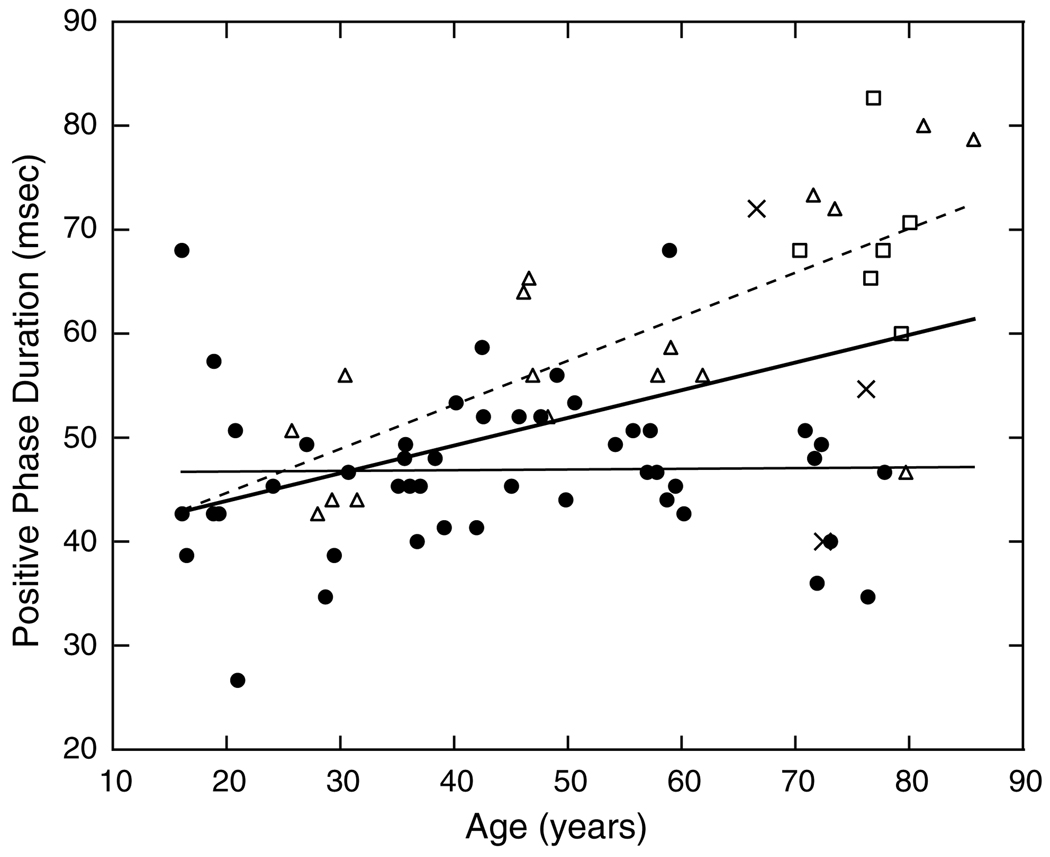
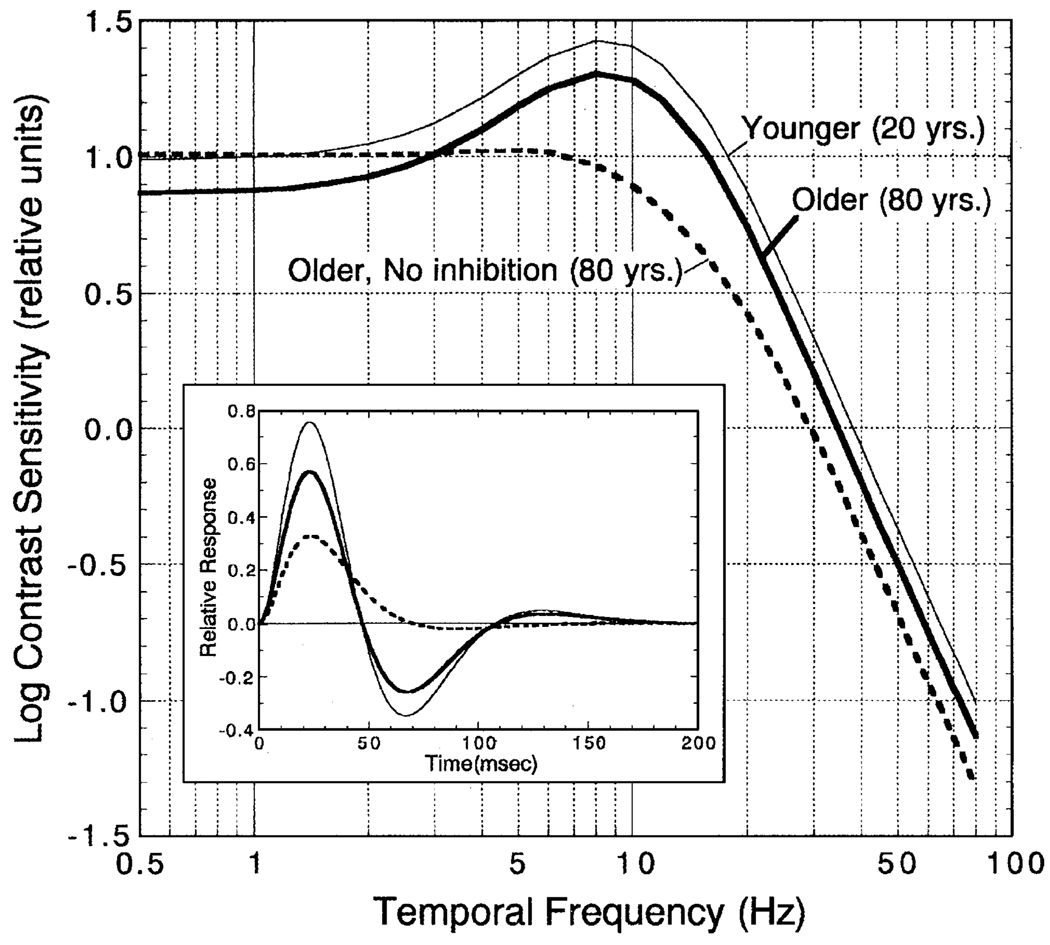
An impulse response function (IRF) to a luminous pulse was derived for 70 normal observers ranging in age from 16 to 86 years. Thresholds were measured for two pulses separated by interstimulus intervals from 6.7 to 180 ms. The pulses had a spatial Gaussian shape (+/-1SD=2.3 degrees diam) and were presented as increments on a 10 cd/m(2) background, having the same chromaticity as the pulse. A spatial 4-alternative forced-choice method was combined with a staircase procedure. Retinal illuminance was equated individually by heterochromatic flicker photometry and control of pupil area. Each IRF was measured four times, in separate sessions, for each observer. IRFs calculated from the threshold data revealed significant age-related changes in the response amplitude of both excitatory and inhibitory phases. In general, there were no significant changes in the time to the first peak or in the first zero crossing. For 12 of 20 observers over 60 years of age, however, the amplitude of the second (inhibitory) phase was reduced relative to the excitatory phase so their IRFs were quite slow and long. Control conditions with three pseudophakic observers and two normal observers with induced blur demonstrated that age-related changes in the IRF under these conditions cannot be ascribed to optical factors. The data suggest that the human visual system generally maintains a stable speed of response to a flash until at least about 80 years of age, even while there are senescent reductions in response signal amplitude.


Figures

Fig. 1
Fig. 1
Central panel shows log contrast threshold as a function of ISI. Insets show the theoretical manner in which threshold varies due to the phase relations of the responses generated by each pulse pair.
Fig. 2
Fig. 2
Left panel shows contrast thresholds and model fits plotted as a function of ISI for two observers: open symbols and dashed curve, age 18.8 years; closed symbols and solid curve, age 60.2 years. Error bars denote ±1 SEM. Right panel shows IRFs calculated from Eq. (1) for the same two observers with dashed and solid curves as in the left panel.
Fig. 3
Fig. 3
Left panel shows contrast thresholds and model fits plotted as a function of ISI for a 37.0-year-old observer. Error bars denote ±1 SEM. Right panel shows the corresponding IRF calculated from Eq. (1).
Fig. 4
Fig. 4
Left panel shows contrast thresholds and model fits plotted as a function of ISI for a 71.6-year-old observer. Error bars denote ±1 SEM. Right panel shows corresponding IRF calculated from Eq. (1).
Fig. 5
Fig. 5
Amplitude of the first (positive, excitatory) phase of the IRF is plotted as a function of age. The regression line was fitted to the data of all (phakic) observers denoted by filled symbols. X’s denote pseudophakic observers.
Fig. 6
Fig. 6
Amplitude of the second (negative, inhibitory) phase of the IRF is plotted as a function of age. Regression line was fitted to the data of all observers denoted by filled symbols. X’s denote pseudophakic observers.
Fig. 7
Fig. 7
Time to peak of the first (positive, excitatory) phase of the IRF is plotted as a function of age. The regression line was fitted to the data of all observers denoted by filled symbols. X’s denote pseudophakic observers.
Fig. 8
Fig. 8
Duration of the first (positive, excitatory) phase of the IRF is plotted as a function of age. Bold regression line was fitted to all phakic observers. X’s denote pseudophakic observers. Filled circles and thin solid regression line represents phakic observers except for those with little (Δ) or no (□) inhibitory amplitude. The dashed regression line was fitted based on the latter observers.
Fig. 9
Fig. 9
Time to peak of the second (negative, inhibitory) phase of the IRF is plotted as a function of age. Symbols and regression lines as in Fig. 8.
Fig. 10
Fig. 10
Temporal contrast sensitivity functions (tCSFs) for theoretical 20-year-old (thin smooth curve) and 80-year-old observers with normal or no second phase (inhibitory) amplitude. Log contrast sensitivity in relative units is plotted as a function of temporal frequency. Inset: The theoretical IRFs used to generate these tCSFs calculated from Eq. (1). Curves are plotted as in the main figure.

References

    1. Benardete EA. Ph.D. dissertation. New York: The Rockefeller University; 1994. Functional dynamics of primate retinal ganglion cells.
    1. Bowen RW. Two pulses seen as three flashes: A superposition analysis. Vision Research. 1989;29:409–417. - PubMed
    1. Burr DC, Morrone MC. Impulse-response functions for chromatic and achromatic stimuli. Journal of the Optical Society of America A. 1993;10:1706–1713.
    1. Burr DC, Morrone MC. Temporal impulse response functions for luminance and colour during saccades. Vision Research. 1996;36:2069–2978. - PubMed
    1. Charman WN. Effect of refractive error in visual tests with sinusoidal gratings. British Journal of Optometry. 1979;33:10–20. - PubMed

Publication types