. 2003 Mar;47(3):948-55.
doi: 10.1128/AAC.47.3.948-955.2003.

Proteomic approach to understanding antibiotic action

Affiliations

Proteomic approach to understanding antibiotic action

Julia Elisabeth Bandow et al. Antimicrob Agents Chemother. 2003 Mar.

Abstract

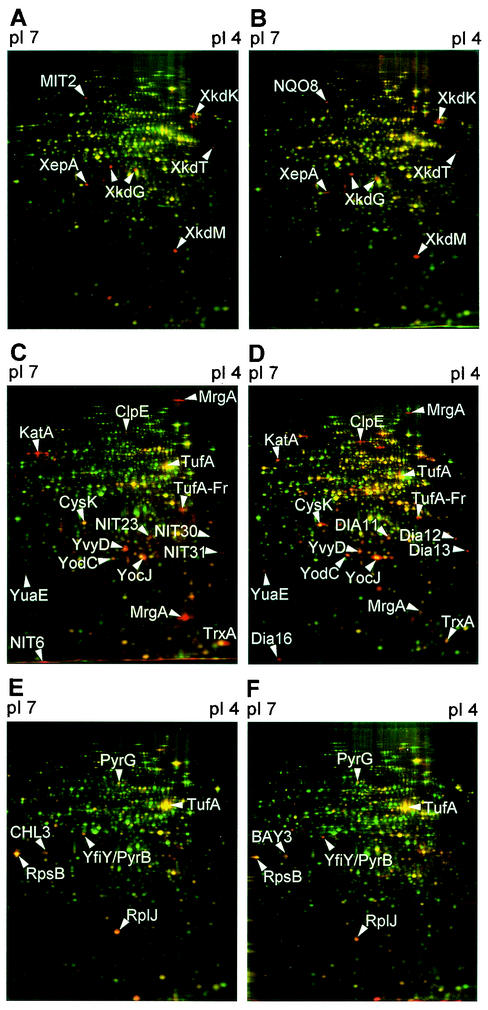
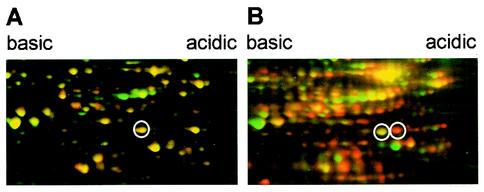
We have used proteomic technology to elucidate the complex cellular responses of Bacillus subtilis to antimicrobial compounds belonging to classical and emerging antibiotic classes. We established on two-dimensional gels a comprehensive database of cytoplasmic proteins with pIs covering a range of 4 to 7 that were synthesized during treatment with antibiotics or agents known to cause generalized cell damage. Although each antibiotic showed an individual protein expression profile, overlaps in the expression of marker proteins reflected similarities in molecular drug mechanisms, suggesting that novel compounds with unknown mechanisms of action may be classified. Indeed, one such substance, a structurally novel protein synthesis inhibitor (BAY 50-2369), could be classified as a peptidyltransferase inhibitor. These results suggest that this technique gives new insights into the bacterial response toward classical antibiotics and hints at modes of action of novel compounds. Such a method should prove useful in the process of antibiotic drug discovery.


Figures

FIG. 1.
FIG. 1.
The protein expression profiles of B. subtilis 168 60 to 65 min after treatment with mitomycin C at 0.08 μg/ml (the MIC) (A) and 4-nitroquinoline-1-oxide at 2.5 μg/ml (five times the MIC) (B) share marker proteins. Marker proteins overlap strongly for the protein expression profiles obtained 10 to 15 min after treatment with nitrofurantoin at 50 μg/ml (five times the MIC) (C) and diamide at 170 μg/ml (two times the MIC) (D). Also, the protein expression profiles obtained 10 to 15 min after treatment with chloramphenicol at 15 μg/ml (five times the MIC) (E) and BAY 50-2369 at 0.5 μg/ml (the MIC) (F) have marker proteins in common. 2D-PAGE was used to separate pulse-labeled cytoplasmic proteins in the pI range of 4 to 7 according to their pIs and Mrs. Red false-color images of autoradiographs of antibiotic-treated cells are warped to fit onto the corresponding green control images. Proteins induced by the antibiotic appear red, repressed proteins appear green, and proteins which are synthesized in the control as well as after antibiotic treatment appear yellow. Arrowheads indicate shared marker proteins (for a full list of marker proteins, see supplementary material at http://microbio2.biologie.uni-greifswald.de:8880/antibiotics/).
FIG. 2.
FIG. 2.
Treatment of B. subtilis with actinonin leads to a shift in the pI of the newly synthesized protein fraction. The newly synthesized pulse-labeled protein fraction was set against SYPRO Ruby-stained total protein. The details of 2D images show red false-color images of autoradiographs of untreated control cells (A) and cells treated with actinonin at 125 μg/ml (five times the MIC) for 10 min (B) that are warped to fit onto the corresponding green images of the SYPRO Ruby-stained gels. Proteins that had already accumulated before actinonin treatment and that are still being synthesized during the l-[35S]methionine pulse appear yellow. Accumulated proteins no longer synthesized appear green, and proteins newly induced in response to actinonin treatment appear red. Circles exemplify one protein which shifts to a more acidic pI after actinonin treatment.

References

    1. Anagnostopoulos, C., and J. Spizizen. 1961. Requirements for transformation in Bacillus subtilis. J. Bacteriol. 81:741-746. - PMC - PubMed
    1. Antelmann, H., J. Bernhardt, R. Schmid, H. Mach, U. Volker, and M. Hecker. 1997. First steps from a two-dimensional protein index towards a response-regulation map for Bacillus subtilis. Electrophoresis 18:1451-1463. - PubMed
    1. Bandow, J. E., H. Brötz, and M. Hecker. 2002. Bacillus subtilis tolerance of moderate concentrations of rifampin involves the sigma(B)-dependent general and multiple stress response. J. Bacteriol. 184:459-467. - PMC - PubMed
    1. Bandow, J. E., D. Becher, K. Büttner, F. Hochgräfe, C. Freiberg, H. Brötz, and M. Hecker. The role of peptide deformylase in protein biosynthesis-a proteomic study. Proteomics, in press. - PubMed
    1. Bernhardt, J., K. Buttner, C. Scharf, and M. Hecker. 1999. Dual channel imaging of two-dimensional electropherograms in Bacillus subtilis. Electrophoresis 20:2225-2240. - PubMed

Publication types

MeSH terms