

A global representation of the protein fold space
- PMID: 12606708
- PMCID: PMC151350
- DOI: 10.1073/pnas.2628030100
A global representation of the protein fold space
Abstract
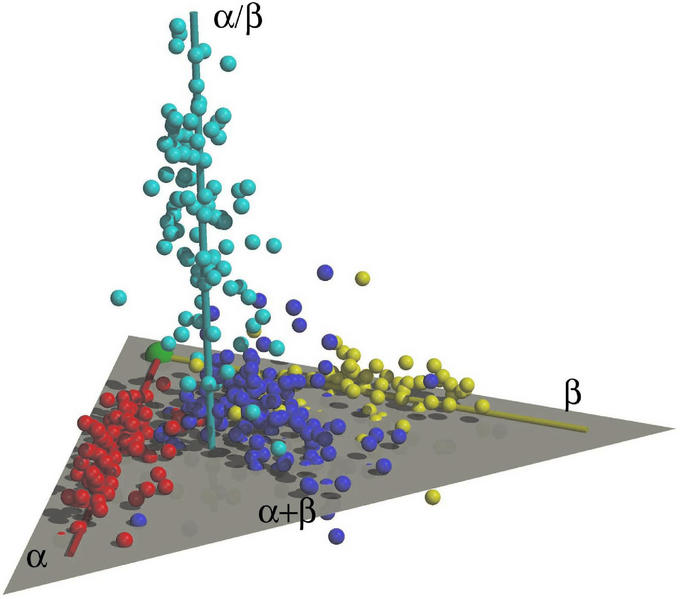
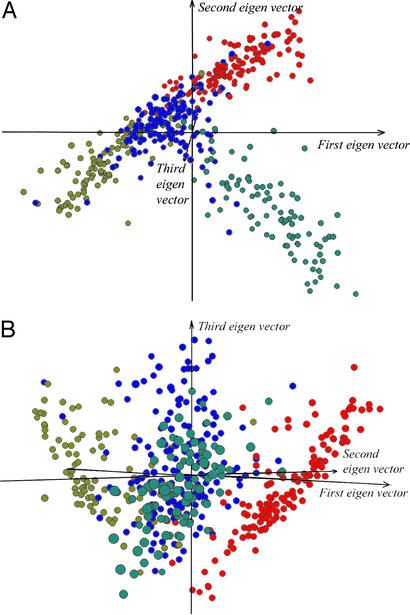
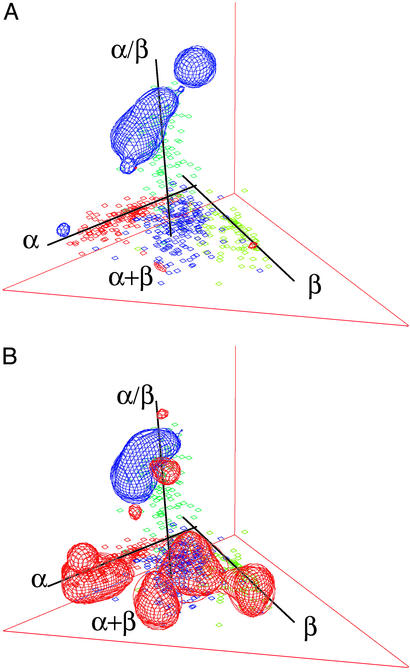
One of the principal goals of the structural genomics initiative is to identify the total repertoire of protein folds and obtain a global view of the "protein structure universe." Here, we present a 3D map of the protein fold space in which structurally related folds are represented by spatially adjacent points. Such a representation reveals a high-level organization of the fold space that is intuitively interpretable. The shape of the fold space and the overall distribution of the folds are defined by three dominant trends: secondary structure class, chain topology, and protein domain size. Random coil-like structures of small proteins and peptides are mapped to a region where the three trends converge, offering an interesting perspective on both the demography of fold space and the evolution of protein structures.
Figures
Similar articles
-
Protein folding and the organization of the protein topology universe.Trends Biochem Sci. 2005 Jan;30(1):13-9. doi: 10.1016/j.tibs.2004.11.008. Trends Biochem Sci. 2005. PMID: 15653321 Review.
-
Connecting the protein structure universe by using sparse recurring fragments.Structure. 2005 Aug;13(8):1213-24. doi: 10.1016/j.str.2005.05.009. Structure. 2005. PMID: 16084393
-
The continuity of protein structure space is an intrinsic property of proteins.Proc Natl Acad Sci U S A. 2009 Sep 15;106(37):15690-5. doi: 10.1073/pnas.0907683106. Epub 2009 Sep 1. Proc Natl Acad Sci U S A. 2009. PMID: 19805219 Free PMC article.
-
A consensus view of fold space: combining SCOP, CATH, and the Dali Domain Dictionary.Protein Sci. 2003 Oct;12(10):2150-60. doi: 10.1110/ps.0306803. Protein Sci. 2003. PMID: 14500873 Free PMC article.
-
Protein modeling with reduced representation: statistical potentials and protein folding mechanism.Acta Biochim Pol. 2005;52(4):741-8. Epub 2005 May 31. Acta Biochim Pol. 2005. PMID: 15933762 Review.
Cited by
-
Exploring fold space preferences of new-born and ancient protein superfamilies.PLoS Comput Biol. 2013;9(11):e1003325. doi: 10.1371/journal.pcbi.1003325. Epub 2013 Nov 14. PLoS Comput Biol. 2013. PMID: 24244135 Free PMC article.
-
Universal partitioning of the hierarchical fold network of 50-residue segments in proteins.BMC Struct Biol. 2009 May 20;9:34. doi: 10.1186/1472-6807-9-34. BMC Struct Biol. 2009. PMID: 19454039 Free PMC article.
-
Sequence-structure-function relationships in the microbial protein universe.Nat Commun. 2023 Apr 26;14(1):2351. doi: 10.1038/s41467-023-37896-w. Nat Commun. 2023. PMID: 37100781 Free PMC article.
-
Clustering tendency in the protein fold space.Bioinformation. 2010 Feb 28;4(8):347-51. doi: 10.6026/97320630004347. Bioinformation. 2010. PMID: 20975898 Free PMC article.
-
Similarity measures for protein ensembles.PLoS One. 2009;4(1):e4203. doi: 10.1371/journal.pone.0004203. Epub 2009 Jan 15. PLoS One. 2009. PMID: 19145244 Free PMC article.
References
-
- Richardson J S. Adv Protein Chem. 1981;34:167–339. - PubMed
-
- Chothia C. Nature. 1992;357:543–544. - PubMed
-
- Zhang C, DeLisi C. J Mol Biol. 1998;284:1301–1305. - PubMed
-
- Kim S H. Nat Struct Biol. 1998;5,Suppl.:643–645. - PubMed
-
- Sanchez R, Pieper U, Melo F, Eswar N, Marti-Renom M A, Madhusudhan M S, Mirkovic N, Sali A. Nat Struct Biol. 2000;7,Suppl.:986–990. - PubMed
Publication types
MeSH terms
Substances
Grants and funding
LinkOut - more resources
Full Text Sources
