

Forces and pressures in DNA packaging and release from viral capsids
- PMID: 12609865
- PMCID: PMC1302732
- DOI: 10.1016/S0006-3495(03)74971-6
Forces and pressures in DNA packaging and release from viral capsids
Abstract
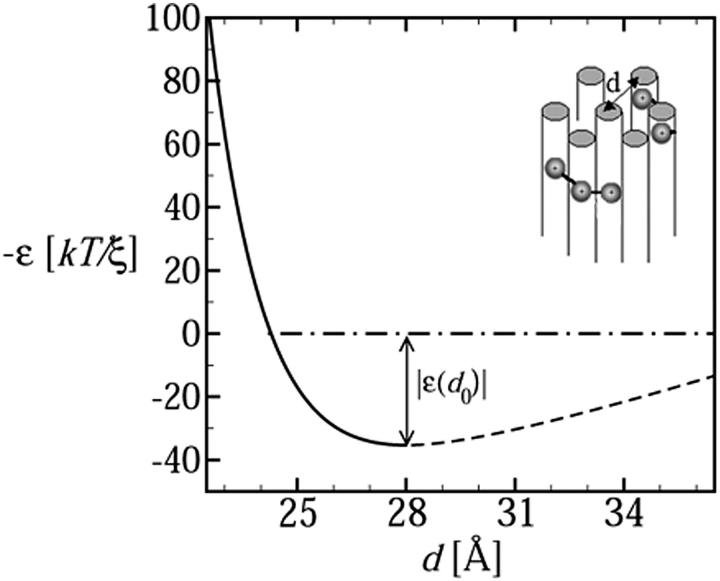
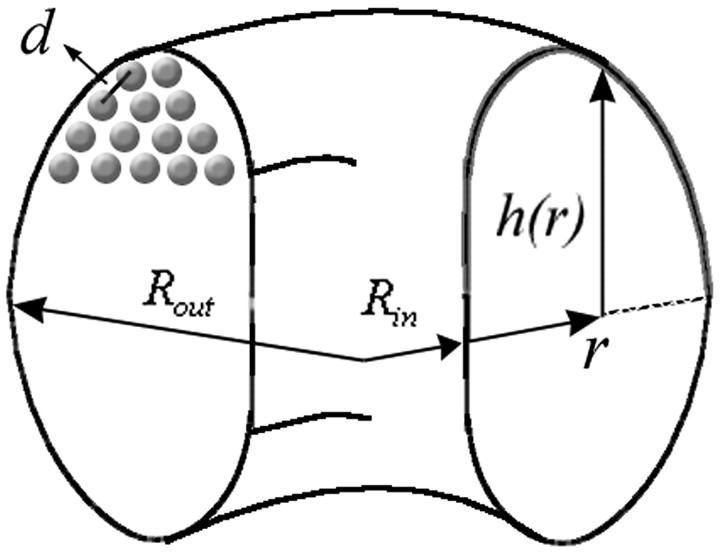
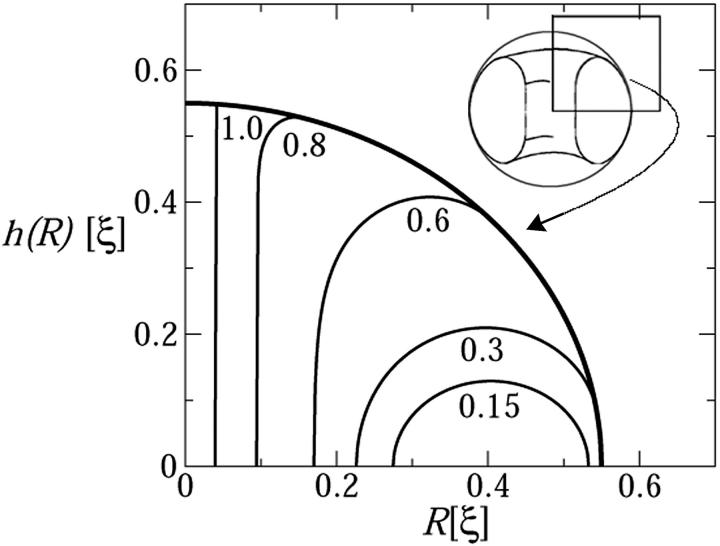
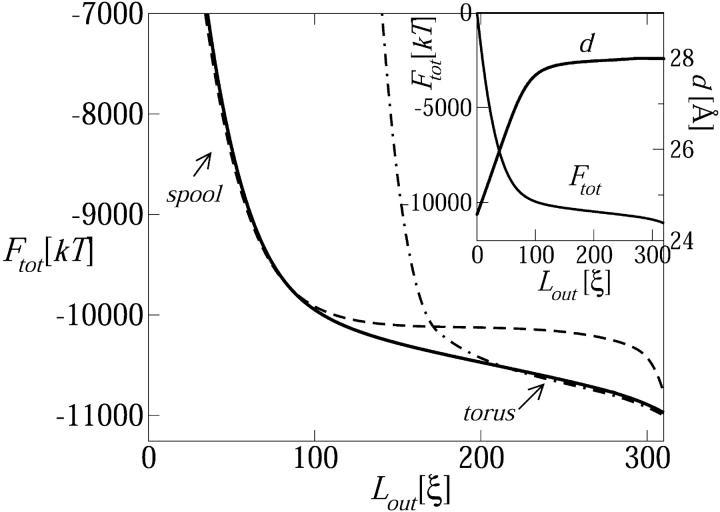
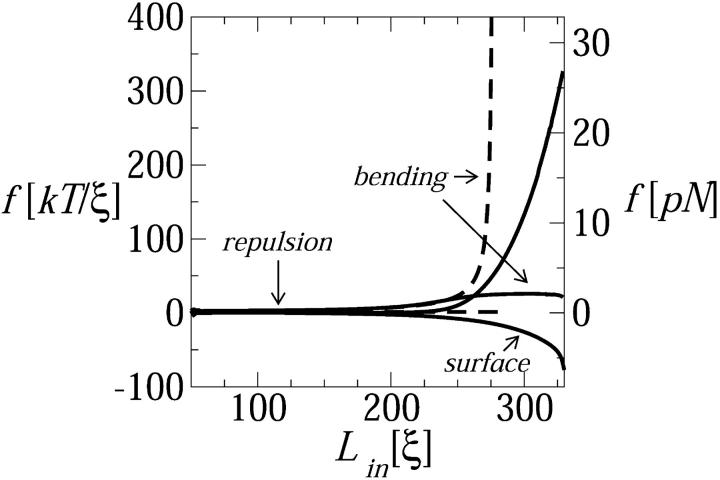
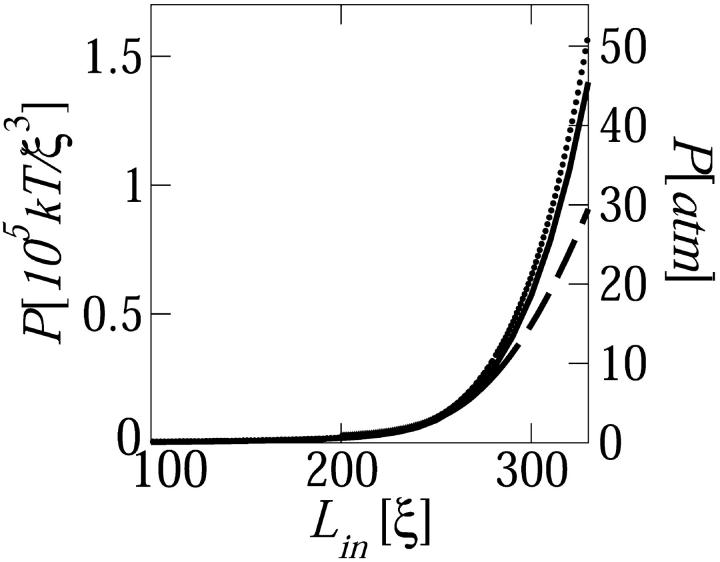
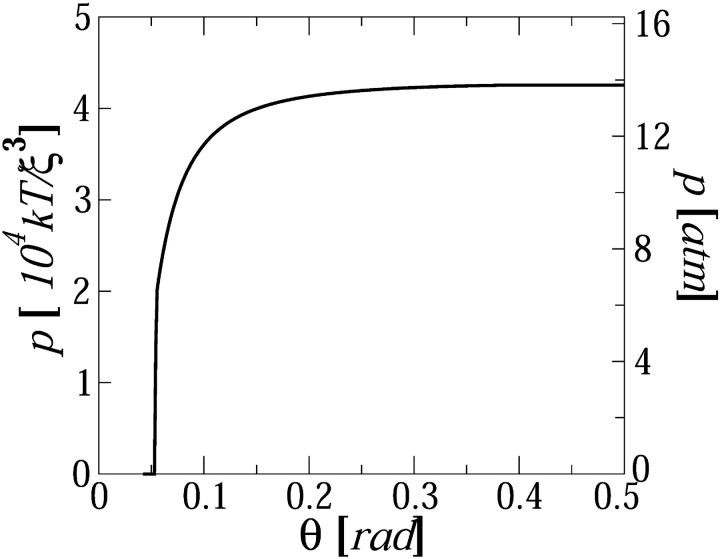
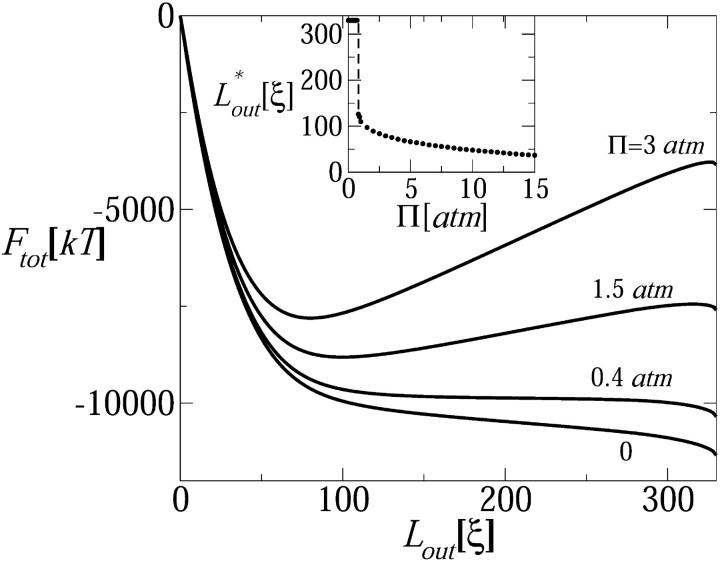
In a previous communication (Kindt et al., 2001) we reported preliminary results of Brownian dynamics simulation and analytical theory which address the packaging and ejection forces involving DNA in bacteriophage capsids. In the present work we provide a systematic formulation of the underlying theory, featuring the energetic and structural aspects of the strongly confined DNA. The free energy of the DNA chain is expressed as a sum of contributions from its encapsidated and released portions, each expressed as a sum of bending and interstrand energies but subjected to different boundary conditions. The equilibrium structure and energy of the capsid-confined and free chain portions are determined, for each ejected length, by variational minimization of the free energy with respect to their shape profiles and interaxial spacings. Numerical results are derived for a model system mimicking the lambda-phage. We find that the fully encapsidated genome is highly compressed and strongly bent, forming a spool-like condensate, storing enormous elastic energy. The elastic stress is rapidly released during the first stage of DNA injection, indicating the large force (tens of pico Newtons) needed to complete the (inverse) loading process. The second injection stage sets in when approximately 1/3 of the genome has been released, and the interaxial distance has nearly reached its equilibrium value (corresponding to that of a relaxed torus in solution); concomitantly the encapsidated genome begins a gradual morphological transformation from a spool to a torus. We also calculate the loading force, the average pressure on the capsid's walls, and the anisotropic pressure profile within the capsid. The results are interpreted in terms of the (competing) bending and interaction components of the packing energy, and are shown to be in good agreement with available experimental data.
Figures
References
-
- Black, L. W. 1989. DNA packaging in dsDNA bacteriophages. Annu. Rev. Microbiol. 43:267–292. - PubMed
-
- Bloomfield, V. A. 1996. DNA condensation. Curr. Opin. Struct. Biol. 6:334–341. - PubMed
-
- Cairns, J., G. S. Stent, and J. D. Watson, editors. 1992. Phage and the Origins of Molecular Biology. Cold Spring Harbor Laboratory Press, New York.
-
- Cerritelli, M. E., N. Cheng, A. H. Rosenberg, C. E. McPherson, F. P. Booy, and A. C. Steven. 1997. Encapsidated conformation of bacteriophage T7 DNA. Cell. 91:271–280. - PubMed
-
- Earnshaw, W. C., and S. C. Harrison. 1977. DNA arrangement in isometric phage heads. Nature. 268:598–602. - PubMed
Publication types
MeSH terms
Substances
LinkOut - more resources
Full Text Sources
Other Literature Sources
