Comparative Study
. 2003 Mar;84(3):1660-73.
doi: 10.1016/S0006-3495(03)74975-3.

Paracellular ion channel at the tight junction

Affiliations
Comparative Study

Paracellular ion channel at the tight junction

Vivian W Tang et al. Biophys J. 2003 Mar.

Abstract

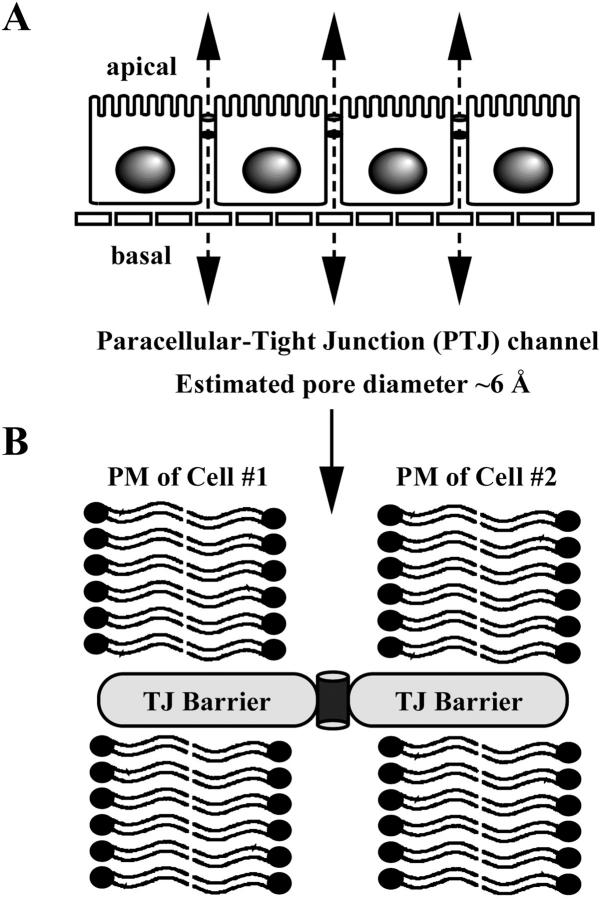
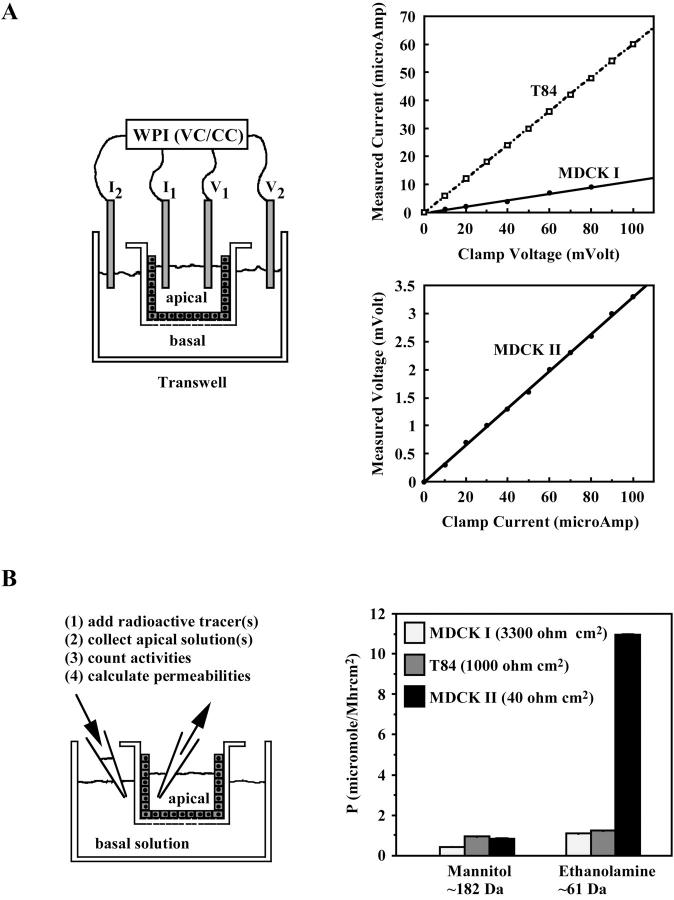
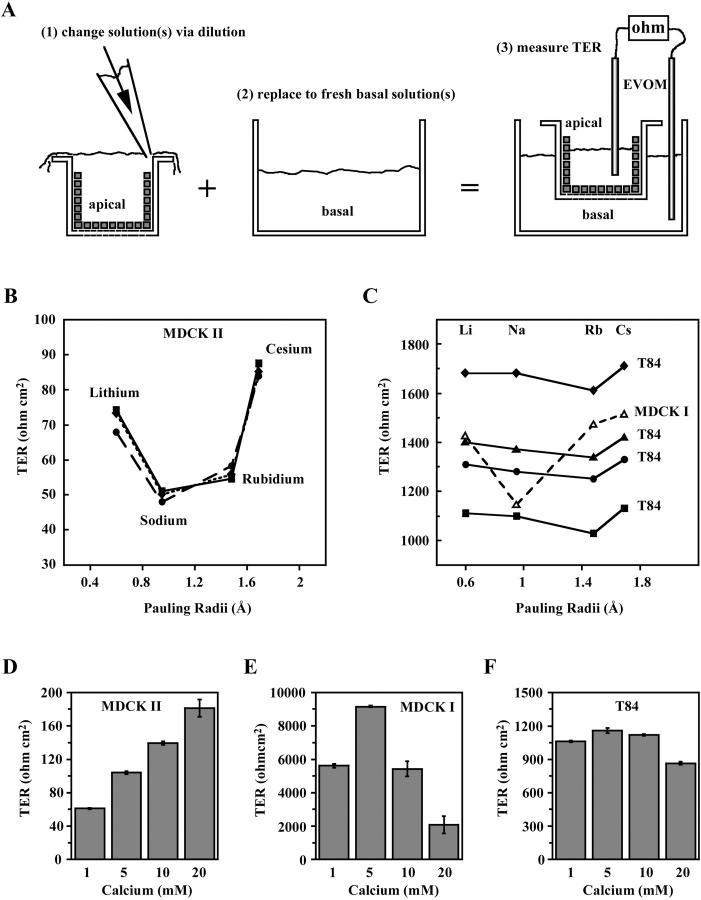
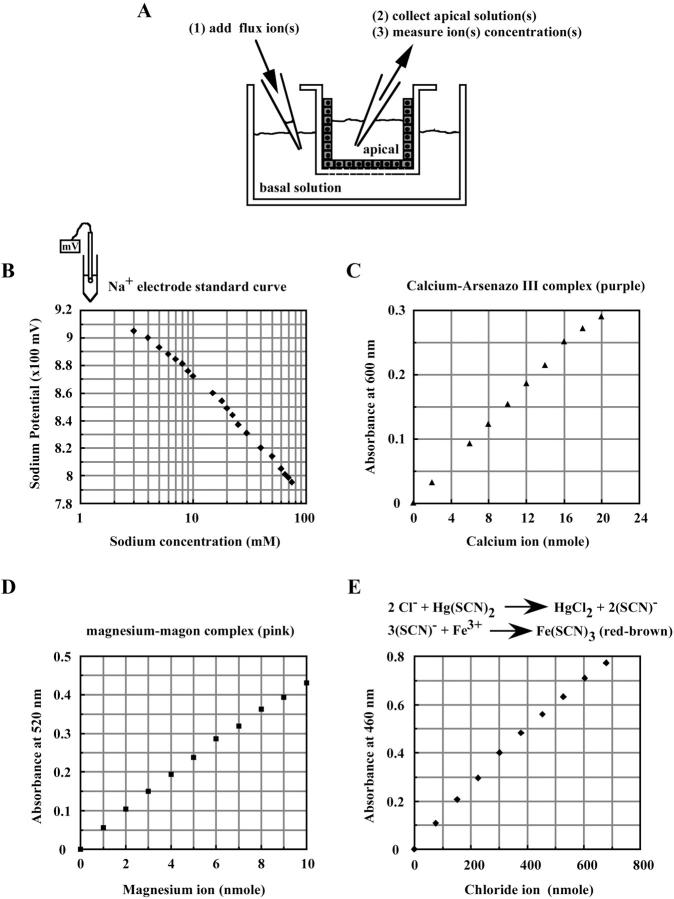
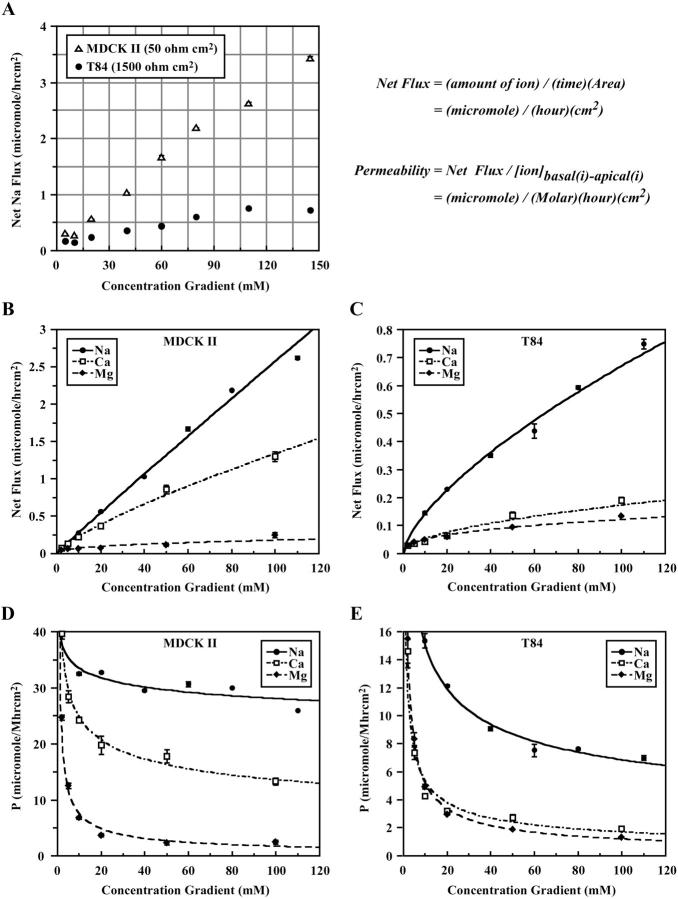
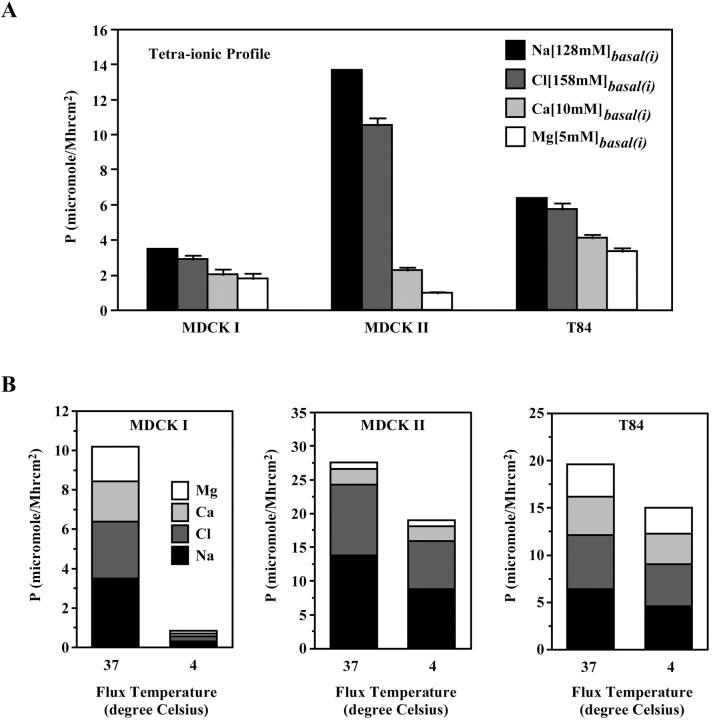
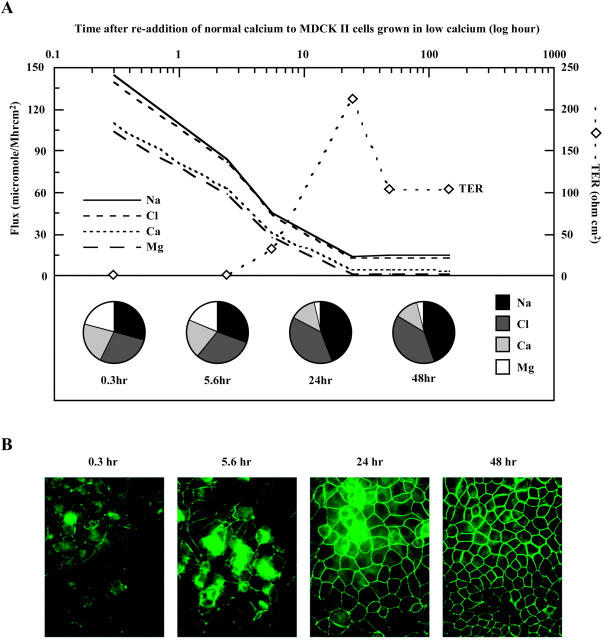
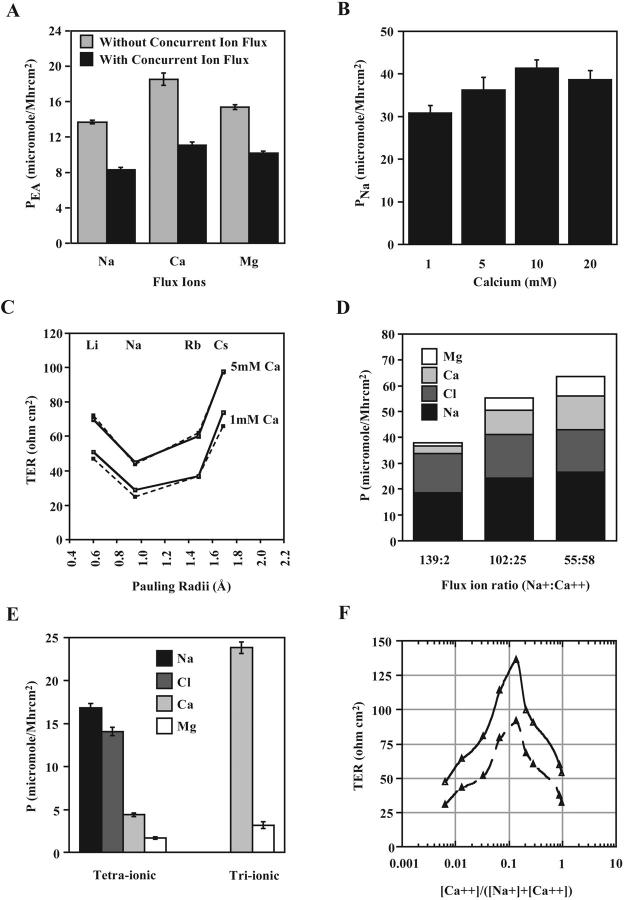
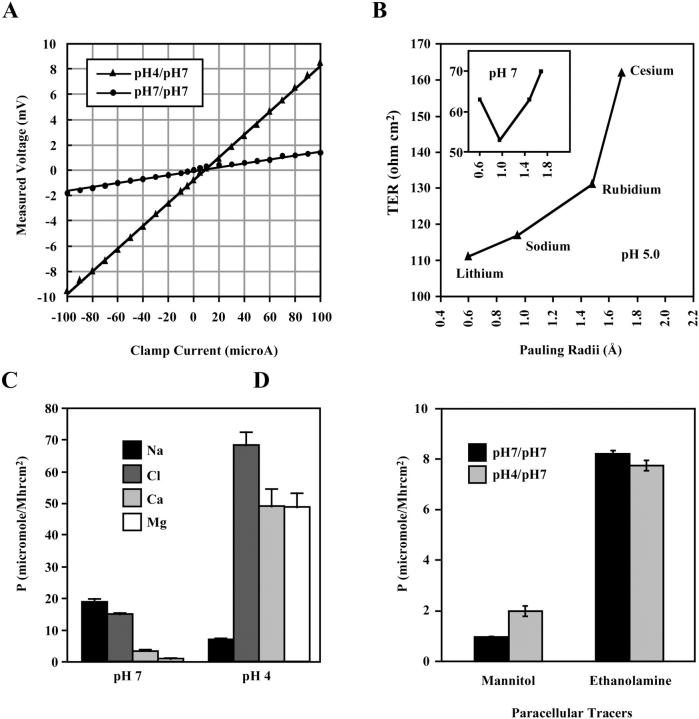
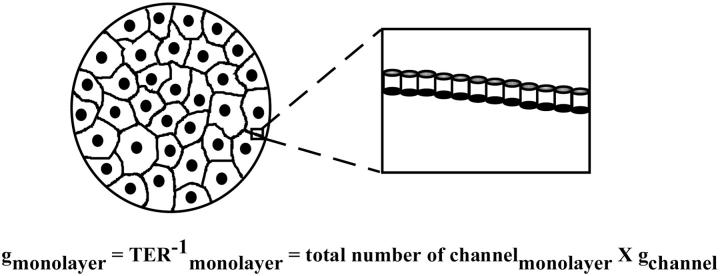
The tight junction of epithelial cells excludes macromolecules but allows permeation of ions. However, it is not clear whether this ion-conducting property is mediated by aqueous pores or by ion channels. To investigate the permeability properties of the tight junction, we have developed paracellular ion flux assays for four major extracellular ions, Na(+), Cl(-), Ca(2+), and Mg(2+). We found that the tight junction shares biophysical properties with conventional ion channels, including size and charge selectivity, dependency of permeability on ion concentration, competition between permeant molecules, anomalous mole-fraction effects, and sensitivity to pH. Our results support the hypothesis that discrete ion channels are present at the tight junction. Unlike conventional ion channels, which mediate ion transport across lipid bilayers, the tight junction channels must orient parallel to the plane of the plasma membranes to support paracellular ion movements. This new class of paracellular-tight junction channels (PTJC) facilitates the transport of ions between separate extracellular compartments.


Figures

FIGURE 1
FIGURE 1
Paracellular ion permeability. (A) Schematic drawing of the paracellular pathway of an epithelial monolayer. Estimated pore diameter of the paracellular tight junction channel (PTJC) is ∼6 Å. (B) PTJC is inserted at the tight junction permeability barrier.
FIGURE 2
FIGURE 2
Three epithelial cell lines, MDCK I, MDCK II, and T84, had different paracellular ion and tracer permeabilities. (A) Voltage and current clamps showed ohmic I-V relationships in all three cell types. (B) Paracellular tracer fluxes of 14C-ethanolamine and 14C -mannitol in MDCK I, MDCK II, and T84 cells (n = 6).
FIGURE 3
FIGURE 3
Distinct ion selectivities of the MDCK I, MDCK II, and T84 PTJCs. (A) Schematic protocol for measurements of ion selectivities using chopstick electrodes. (B) Monovalent ion selectivities of MDCK II (three monolayers). (C) Monovalent ion selectivities of MDCK I (one monolayer) and T84 (four monolayers). (DF) Ca2+ sensitivities of MDCK I, MDCK II, and T84 PTJCs (n = 3).
FIGURE 4
FIGURE 4
Establishing ion flux assays. (A) Schematic protocol for measurements of paracellular ion fluxes. (B) A Na+ standard curve generated with sodium potentials. (C) A Ca2+ standard curve. (D) A Mg2+ standard curve. (E) A Cl standard curve.
FIGURE 5
FIGURE 5
Paracellular Na+, Ca2+, and Mg2+ flux in MDCK II and T84 cells. (A) Na+ flux in MDCK II and T84 cells, as a function of Na+ concentration gradients (n = 3). (B) Na+, Ca2+, and Mg2+ fluxes in MDCK II cells, as functions of concentration gradients. Net sodium flux was calculated by multiplying the concentration of sodium in the final apical solution (molar, M) by its volume (liter, L), divided by the duration of flux (time, h) and the area of the monolayer (cm2), expressed here as μmol/h cm2. Permeability (μmol/M h cm2) is defined here as the net flux divided by the chemical driving force, which has the same unit as the conventional cm/s. (C) Na+, Ca2+, and Mg2+ fluxes in T84 cells, as functions of concentration gradients. (D) Permeabilities of Na+, Ca2+, and Mg2+ in MDCK II cells, as functions of ion concentration gradients. (E) Permeabilities of Na+, Ca2+, and Mg2+ in T84 cells, as functions of ion concentration gradients. For each data point, n = 3.
FIGURE 6
FIGURE 6
Distinct tetraionic permeability profiles in the three epithelial cells. (A) Concurrent fluxes of Na+, Cl, Ca2+, and Mg2+ in MDCK I, MDKC II, and T84 monolayers (n = 3). (B) Comparison of tetraionic permeabilities at 37°C and 4°C for MDCK I, MDKC II, and T84 monolayers (n = 3).
FIGURE 7
FIGURE 7
Paracellular ion selectivity required the formation of intact tight junctions. (A) Generation of TER and concomitant decline in paracellular ion fluxes upon tight junction formation by the addition of normal calcium to MDCK II cells (t = 0) that had grown in low calcium medium. Y axis on the left showed ion permeabilities from concurrent tetraionic flux, also displayed as fractional fluxes in pie charts. Y axis on the right showed the corresponding transepithelial electrical resistance (TER). Duplicate monolayers were studied for each time point. The graph was generated using a representative measurement for each time point. (B) Immunofluorescence detection of occludin at various time points after calcium induced tight junction formation.
FIGURE 8
FIGURE 8
Competition between Na+ and Ca2+ for transit through MDCK II PTJCs. (A) Diminished 14C-ethanolamine flux in the presence of concurrent Na+, Ca2+, and Mg2+ fluxes (n = 6). (B) Addition of Ca2+ did not affect paracellular Na+ permeability (n = 3). (C) Monovalent ion selectivity remained unaltered in the presence of 5 mM Ca2+. Two cell monolayers are plotted. (D) Increased Ca2+ and Mg2+ permeabilities in increasing ratios of basal Ca2+ to Na+ (n = 2). (E) Comparison of tetraionic and triionic (Ca2+, and Mg2+, and Cl) flux showed increased Ca2+ and Mg2+ permeabilities in the absence of concurrent Na+ flux (n = 3). (F) Anomalous mole-fraction effect between Na+ and Ca2+ by TER measurements. Two monolayers are plotted.
FIGURE 9
FIGURE 9
Effects of low pH on paracellular ion selectivity in MDCK II cells. (A) Current-clamp of a cell monolayer showed increased transepithelial electrical resistance at apical pH 4. (B) Monovalent ion selectivity was disrupted at pH 5, which was readily reversible upon replacement to pH 7 solutions (inset). A representative monolayer is shown. (C) Tetraionic permeability profile at apical pH 4 (n = 3). (D) Tracer fluxes of 14C-mannitol and 14C-ethanolamine at apical pH 4. For each tracer, n = 4.
FIGURE 10
FIGURE 10
Working hypothesis of paracellular tight junction channels.

Similar articles

Cited by

References

    1. Balasubramanian, S., J. W. Lynch, and P. H. Barry. 1995. The permeation of organic cations through cAMP-gated channels in mammalian olfactory receptor neurons. J. Membr. Biol. 146:177–191. - PubMed
    1. Balasubramanian, S., J. W. Lynch, and P. H. Barry. 1997. Concentration dependence of sodium permeation and sodium ion interactions in the cyclic AMP-gated channels of mammalian olfactory receptor neurons. J. Membr. Biol. 159:41–52. - PubMed
    1. Barker, G., and N. L. Simmons. 1981. Identification of two strains of cultured canine renal epithelial cells (MDCK cells) which display entirely different physiological properties. Q. J. Exp. Physiol. 66:61–72. - PubMed
    1. Bell, C. L., and P. M. Quinton. 1992. T84 cells: anion selectivity demostrates expression of Cl− conductance affected in cystic fibrosis. Am. J. Physiol. 262:C555–C562. - PubMed
    1. Cereijido, M. 1984. Electrical properties of Madin-Darby canine kidney cells. Federation Proc. 43:2230–2235. - PubMed

Publication types

MeSH terms