. 2003 Mar;84(3):1674-89.
doi: 10.1016/S0006-3495(03)74976-5.

Regulation of the calcium release channel from skeletal muscle by suramin and the disulfonated stilbene derivatives DIDS, DBDS, and DNDS

Affiliations

Regulation of the calcium release channel from skeletal muscle by suramin and the disulfonated stilbene derivatives DIDS, DBDS, and DNDS

Erin R O'Neill et al. Biophys J. 2003 Mar.

Abstract

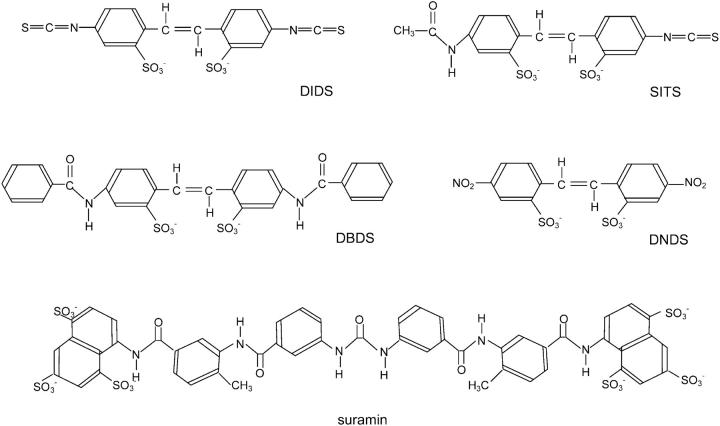
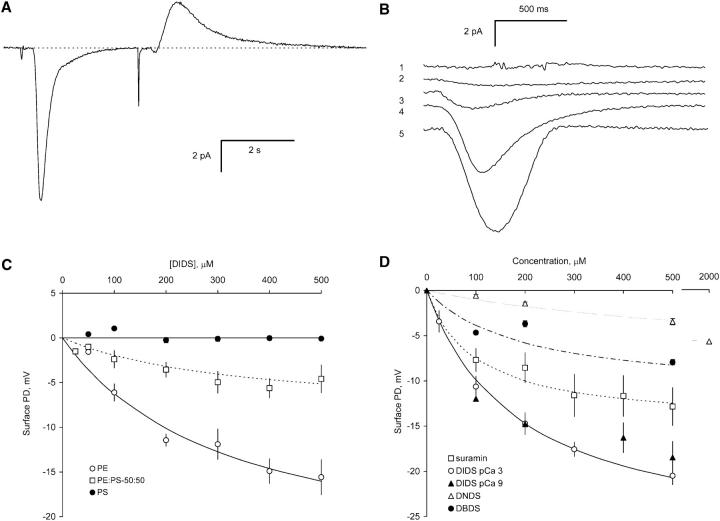
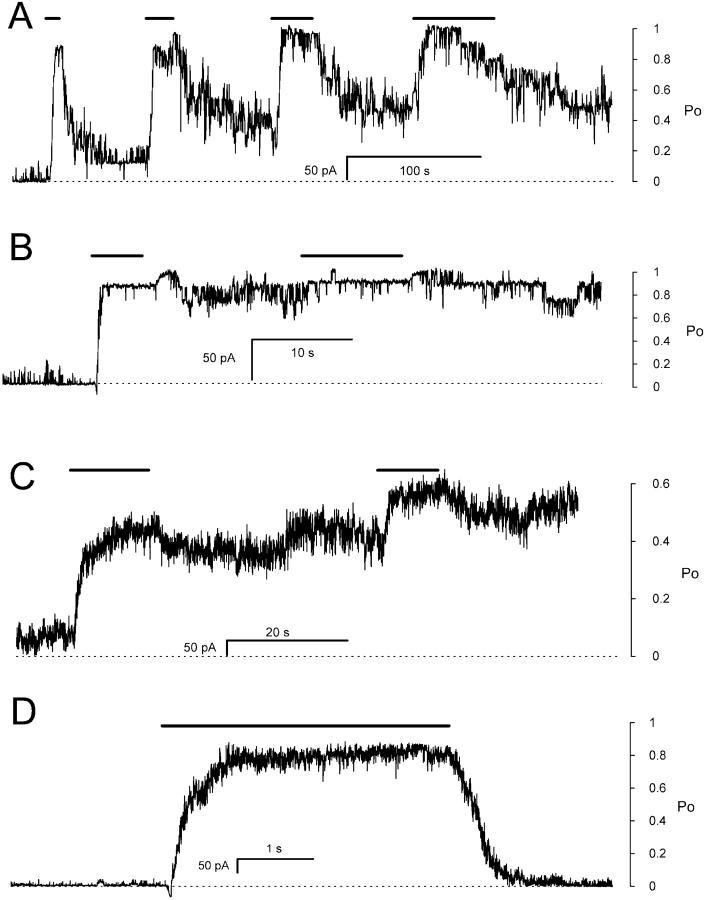
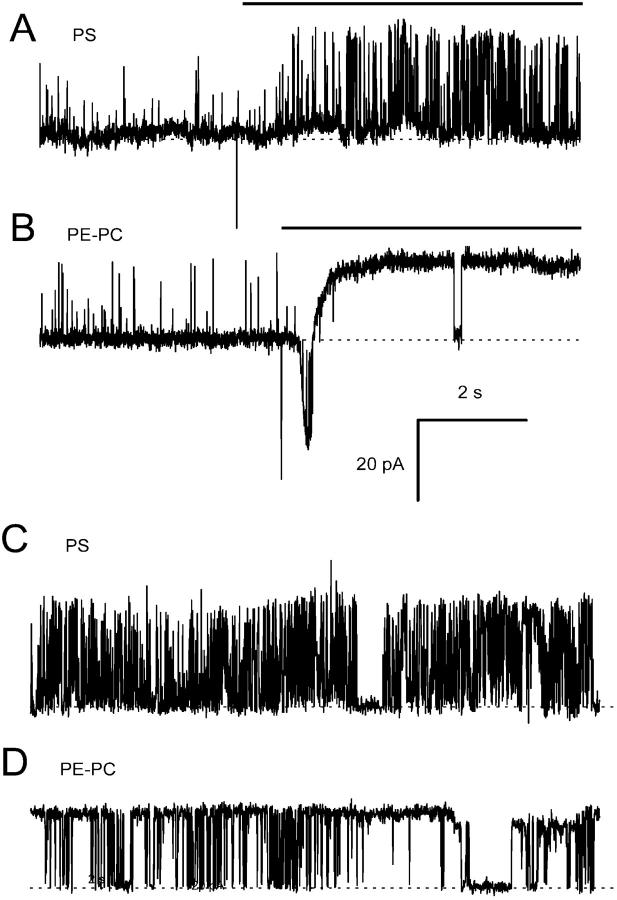
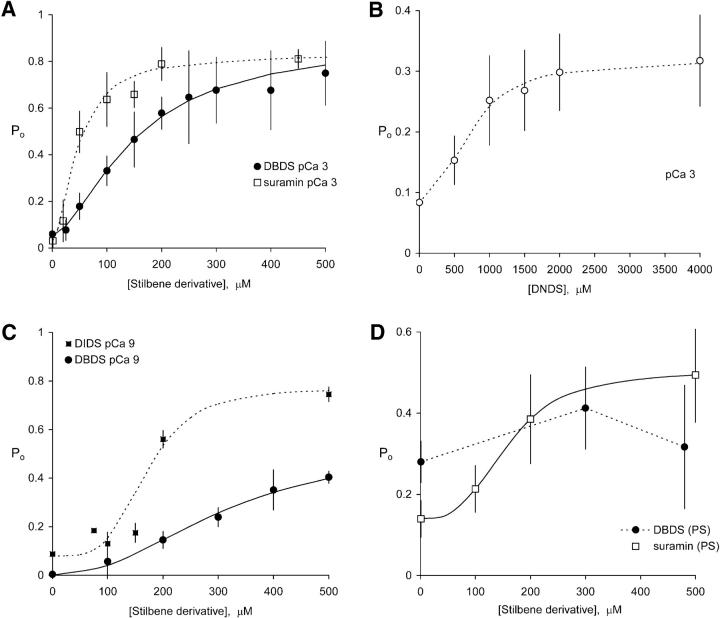
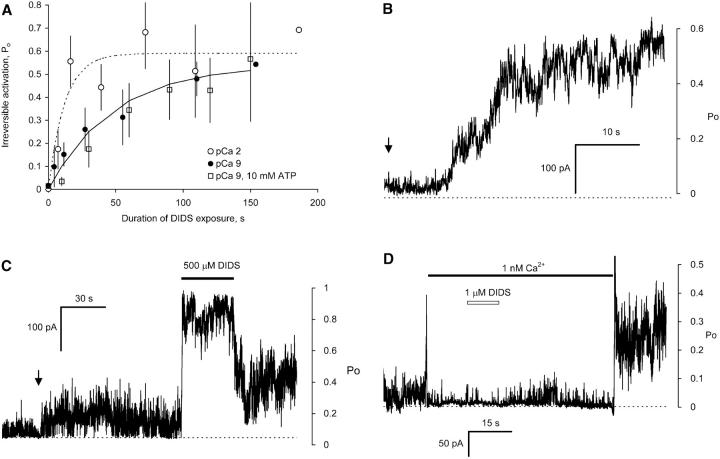
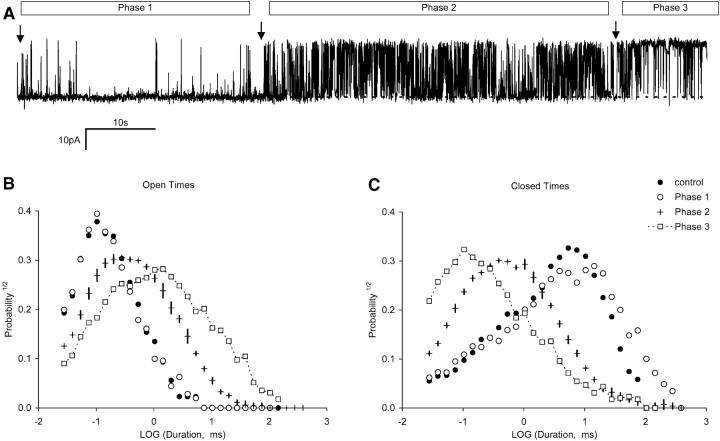
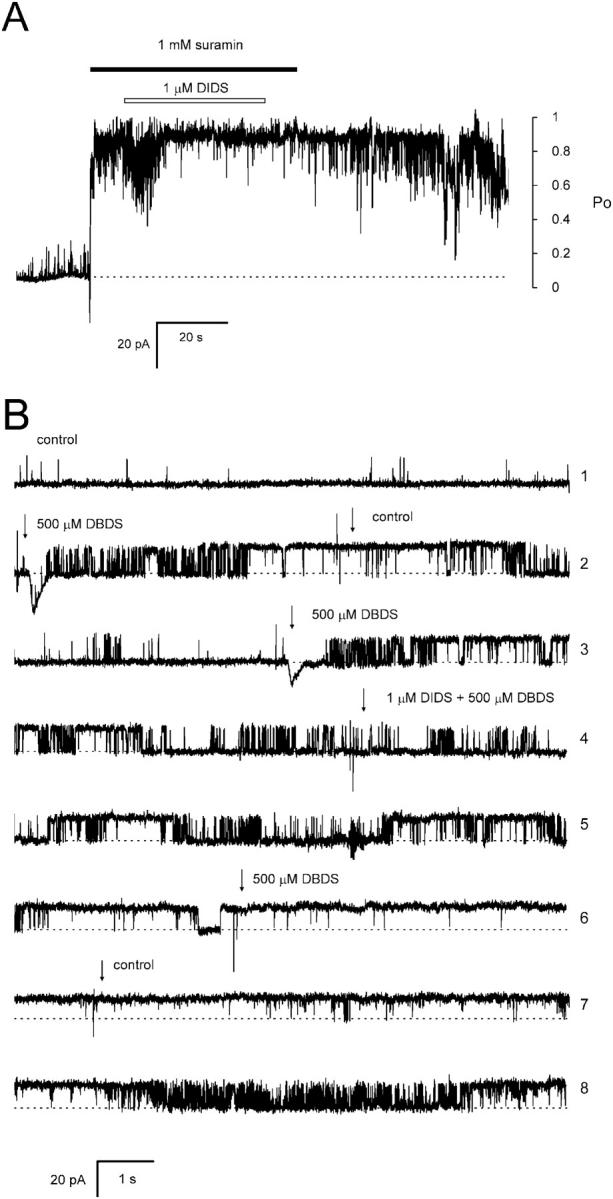
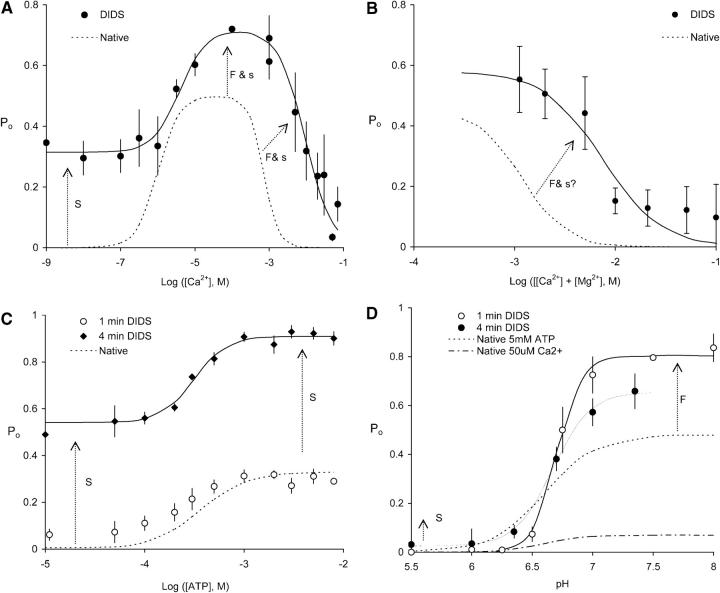
Activation of skeletal muscle ryanodine receptors (RyRs) by suramin and disulfonic stilbene derivatives (Diisothiocyanostilbene-2',2'-disulfonic acid (DIDS), 4,4'-dibenzamidostilbene-2,2'-disulfonic acid (DBDS),and 4,4'-dinitrostilbene-2,2'-disulfonic acid (DNDS)) was investigated using planar bilayers. One reversible and two nonreversible mechanisms were identified. K(a) for reversible activation (approximately 100 micro M) depended on cytoplasmic [Ca(2+)] and the bilayer composition. Replacement of neutral lipids by negative phosphatidylserine increased K(a) fourfold, suggesting that reversible binding sites are near the bilayer surface. Suramin and the stilbene derivatives adsorbed to neutral bilayers with maximal mole fractions between 1-8% and with affinities approximately 100 micro M but did not adsorb to negative lipids. DIDS activated RyRs by two nonreversible mechanisms, distinguishable by their disparate DIDS binding rates (10(5) and 60 M(-1) s(-1)) and actions. Both mechanisms activated RyRs via several jumps in open probability, indicating several DIDS binding events. The fast and slow mechanisms are independent of each other, the reversible mechanism and ATP binding. The fast mechanism confers DIDS sensitivity approximately 1000-fold greater than previously reported, increases Ca(2+) activation and increases K(i) for Ca(2+)/Mg(2+) inhibition 10-fold. The slow mechanism activates RyRs in the absence of Ca(2+) and ATP, increases ATP activation without altering K(a), and slightly increases activity at pH < 6.5. These findings explain how different types of DIDS activation are observed under different conditions.


Figures

FIGURE 1
FIGURE 1
Structural formulae of the commonly used disulfonic stilbene derivatives.
FIGURE 2
FIGURE 2
Changes in bilayer surface potential upon rapid application and removal of DIDS analogs and suramin. (A) Current transients produced by rapid DIDS application (downward) followed by removal (upward). When DIDS solutions came in contact with the bilayer the current departed from its steady baseline (dashed line) and returned to baseline levels after complete solution exchange had occurred. The two downward spikes preceding each transient marks the time that the solenoid valves switched solution flow. (B) The size of the transient current depended on the DIDS concentration and the lipid composition of the bilayer. Trace 1 shows the relatively weak transient in response to 500 μM DIDS applied to PS bilayers. Traces 2–5 show current transients through PE bilayers in response to DIDS concentrations of 50 μM, 100 μM, 200 μM, and 500 μM, respectively. (C) The change in bilayer surface potential caused by DIDS absorption to the bilayer. The surface potential changes on bilayers formed from neutral lipids (PE) are much larger than those seen with negatively charged PS bilayers. This indicates that DIDS preferentially adsorbs to the neutral lipids. (D) The surface potentials generated by adsorption of DIDS, DBDS, DNDS and suramin to bilayers composed of PE and PC (80:20). There was no significant difference in the adsorption of DIDS to the bilayer at 1 nM and 1 mM cytoplasmic Ca2+. The curves show fits of the Stern and Grahame equations to the data (Eqs. 5–9). The parameters used to fit the data are given in Table 1.
FIGURE 3
FIGURE 3
The reversible and nonreversible effects of DIDS and suramin on RyRs in neutral (PE and PC) and charged (PS) bilayers. (A) Nine RyRs in a neutral bilayer in the presence of ∼1 nM cytoplasmic Ca2+ (4.5 mM BAPTA plus 15 μM Ca2+ impurity). Cis addition of 500 μM DIDS (bars) strongly activated all the channels to Po ∼ 1. Washout of DIDS after a 10 s exposure reversed most of the DIDS induced activation. However, subsequent longer exposures (20 s, 30 s, and 60 s) resulted in substantial nonreversible activation of RyRs (n = 8). (B) Similar experiment as A except the cytoplasmic bath contained 1 mM Ca2+. In this experiment 7 RyRs showed strong activation by 500 μM DIDS. However, in the presence of 1 mM Ca2+, a 5 s exposure to DIDS resulted in activation that was mainly nonreversible (n = 10). (C) Approximately 20 RyRs in a PS bilayer in the presence of 1 mM cytoplasmic Ca2+. Again, 500 μM DIDS activated RyRs but the activation was not as complete as seen in parts A and B. Like part B, the nonreversible effect of DIDS was relatively large compared to that seen during similar DIDS exposures in A (n = 5). (D) Approximately 20 RyRs in the presence of 1 mM Ca2+ exposed to 1 mM suramin for the duration of the bar. The effect of suramin was totally reversible. (A–D) Bilayers were held at +40 mV. The current baselines are shown by the dashed lines and approximate scales for mean open probability (Po) of the RyRs at the right of each panel. Drug addition and washout was done using local perfusion, which in these experiments exchanged solutions at the bilayer surface in less than 2 s.
FIGURE 4
FIGURE 4
Representative recordings of the effect of bilayer lipid charge on the activation of single RyRs by DIDS and suramin. (A and B) RyR activity in bilayers composed of negative PS (n = 5) and neutral PE:PC (80%:20%, n = 8) before and during exposure to 500 μM DIDS (bar). (C and D) Similar bilayers with RyRs continuously exposed to 200 μM suramin (n = 10 for PS, n = 10 for PE:PC). Channel openings are upward current transitions from the baseline (dashed lines). RyR activation was more pronounced in bilayers composed of neutral lipids. Note the current transient associated with DIDS adsorption to neutral lipids in B which is absent from bilayers composed of PS lipids in A. Bilayers were held at +40 mV and cis [Ca2+] = 1 mM.
FIGURE 5
FIGURE 5
The reversible effects of DIDS, DBDS, DNDS, and suramin, on the open probability of RyRs. (A) Activation of RyRs by DBDS (4, 23) or suramin (10,175) in neutral bilayers, in the presence of 1 mM cytoplasmic Ca2+. (B) DNDS activation of RyRs (4, 30) in neutral bilayers in the presence of 1 mM cytoplasmic Ca2+. (C) Activation of RyRs by DBDS (3, 18) and DIDS (4, 62) in neutral bilayers in the absence of Ca2+. For the DIDS experiments short exposure times (∼5 s) were used so that the activation was largely due to the reversible effects of DIDS (nonreversible activation by DIDS is relatively slow in the absence of Ca2+, e.g., see Figs. 3 A and 6 A). The relative size of the nonreversible effects can be seen here in Po values at zero [DIDS]. (D) Activation of RyRs by suramin (10, 124) and DBDS (4, 16) in bilayers composed of PS in the presence of 1 mM Ca2+. In bilayers composed of negatively charged PS, suramin and DBDS are much weaker activators of the RyR. The curves show fits of Po to the Hill equation (Eq. 1). The parameters of the fits are given in Table 2. The data points show the means of several experiments, which were mostly carried out on multiple RyRs. Numbers in parentheses represent the numbers of channels and experiments, respectively.
FIGURE 6
FIGURE 6
The time course of DIDS induced nonreversible activation of RyRs. (A) RyRs were repeatedly exposed to 500 μM DIDS for periods lasting 5–60 s. The progressive, nonreversible activation was measured using the experimental protocol shown in Fig. 3 A. The mean Po is plotted against total DIDS exposure time. The curves show exponential fits to each time course. In the absence of cytoplasmic Ca2+, DIDS activated RyRs with a time constants of 48 ± 13 s (6, 50) (no ATP) and 93 ± 36 s (10 mM ATP) (7, 15) and in the presence of 10 mM Ca2+, 12 ± 6 s (8, 126). (B) The activation of ∼15 RyRs in response to 1 μM DIDS (applied at the arrow) in the presence of 100 μM Ca2+. Activation showed a marked latency that was much longer than any delay expected from solution exchange (∼1 s). (C) 12 RyRs in the presence of 3 μM Ca2+ were exposed to 10 μM DIDS (arrow) which activated the RyRs to a steady level for the following 90 s. Subsequently increasing [DIDS] to 500 μM caused an immediate increased in RyR activity which was not completely reversed by returning to 10 μM DIDS. (D) 15 RyRs, initially in 100 μM Ca2+, were perfused with solution with 1 nM Ca2+ (solid bar). During this time the RyRs were exposed to 1 μM DIDS (open bar) which does not significantly activate RyRs under these conditions (see A). However, returning [Ca2+] to 100 μM reveals that DIDS has altered RyR activity. The current spikes that occurred during the [Ca2+] steps are due to Ca2+ activation of RyRs as the [Ca2+] passed through the range 1–100 μM. Approximate scales for mean open probability (Po) of the RyRs are shown at the right of panels BD. Numbers in parentheses represent the numbers of channels and experiments, respectively.
FIGURE 7
FIGURE 7
Nonreversible activation of RyRs by DIDS occurs in several phases. (A) A single RyR is activated by 1 μM DIDS. The first arrow indicates the time when DIDS was applied to the RyR by fast perfusion. The second and third arrows mark abrupt increases in Po. These arrows delineate three apparent phases of channel activation labeled 1 to 3. The Po values of the RyRs during Phases 1 to 3 were 0.028, 0.4, and 0.86, respectively. (B) Open and (C) closed dwell-time distributions from the three phases of channel activation in A plus the control conditions before addition of DIDS. To show the stationarity of gating in Phase 2, dwell-time data were compiled from the first and second halves of this section. Vertical bars through the data indicate the difference in the distributions. The recording was filtered at 5 kHz and sampled at 50 kHz. Channel openings are upward transitions form the baseline (dashed line). The data are plotted using logarithmically spaced bins as described by Sigworth and Sine (1987).
FIGURE 8
FIGURE 8
High concentrations of suramin or DBDS do not protect RyRs from fast DIDS activation. (A) Four RyRs in the presence of 1 mM Ca2+ are exposed to 1 mM suramin (solid bar). During this time the RyRs are exposed to 1 μM DIDS for ∼30 s (open bar). In the presence of suramin DIDS further activated the RyRs and activity did not return to control levels after the removal of DIDS and suramin. (B) Effects of DBDS and DIDS on a single RyR shown in consecutive traces. The top three traces demonstrate reversible activation by DBDS alone. Traces 4–8 show that 20 s DIDS exposure in the presence of DBDS causes nonreversible activation. In these experiments channel openings produce upward current jumps from the baseline (dashed line). Approximate scales for mean Po are shown at the right of A.
FIGURE 9
FIGURE 9
Regulation of DIDS modified and native RyRs by cytoplasmic Ca2+, Mg2+, ATP, and pH. Also shown are theoretical fits to the data from DIDS modified RyRs (solid curves) and from native RyRs obtained previously (dashed lines, the original data have been omitted for clarity). (A) Regulation by cytoplasmic Ca2+ (20, 95) of RyRs exposed to 100 μM DIDS for 3–4 min. (B) Mg2+ inhibition in the presence of 1 mM Ca2+ (2, 30) of RyRs exposed to 100 μM DIDS for 1 min. (C) ATP activation in the absence of Ca2+ (5, 83) of exposed to 100 μM DIDS for either 1 or 4 min. One minute incubation with DIDS produced relatively little activation reflecting the low rate of DIDS activation. (D) Inhibition by low pH in the presence of 100 μM Ca2+ (6, 20) of RyRs exposed to 100 μM DIDS for either 1 or 4 min. pH was buffered using 5 mM TES and 5 mM MES (2-[N-Morpholino]ethane-sulfonic acid). RyRs. DIDS had no significant effect on pKi but did produce a significant but small increase in RyR activation at pH below 6.5. The parameters for the fitted curves are listed in Table 3 and the sources for the native RyR data are listed in the Table caption. The arrows indicate specific RyR properties that are modified by fast (F) and slow (S) DIDS mechanisms. Upper case labels indicate major contributions by fast and slow mechanism and lower case symbols indicate minor contributions. Numbers in parentheses represent the numbers of channels and experiments, respectively.

Similar articles

Cited by

References

    1. Brooks, S. P., and K. B. Storey. 1992. Bound and determined: a computer program for making buffers of defined ion concentrations. Anal. Biochem. 201:119–126. - PubMed
    1. Chu, A., M. C. Dixon, A. Saito, S. Seiler, and S. Fleischer. 1988. Isolation of sarcoplasmic reticulum fractions referable to longitudinal tubules and junctional terminal cisternae from rabbit skeletal muscle. Methods Enzymol. 157:36–50. - PubMed
    1. Coronado, R., J. Morrissette, M. Sukhareva, and D. M. Vaughan. 1994. Structure and function of ryanodine receptors. Am. J. Physiol. 266:C1485–C1504. - PubMed
    1. Dunn, P. M., and A. G. Blakeley. 1988. Suramin: a reversible P2-purinoceptor antagonist in the mouse vas deferens. Br. J. Pharmacol. 93:243–245. - PMC - PubMed
    1. Grahame, D. C. 1947. The electrical double layer and the theory of electrocapillarity. Chem. Rev. 41:441–501. - PubMed

Publication types

MeSH terms

LinkOut - more resources