Comparative Study
. 2003 Mar;84(3):1690-700.
doi: 10.1016/S0006-3495(03)74977-7.

Direct activation of gastric H,K-ATPase by N-terminal protein kinase C phosphorylation. Comparison of the acute regulation mechanisms of H,K-ATPase and Na,K-ATPase

Affiliations
Comparative Study

Direct activation of gastric H,K-ATPase by N-terminal protein kinase C phosphorylation. Comparison of the acute regulation mechanisms of H,K-ATPase and Na,K-ATPase

Flemming Cornelius et al. Biophys J. 2003 Mar.

Abstract

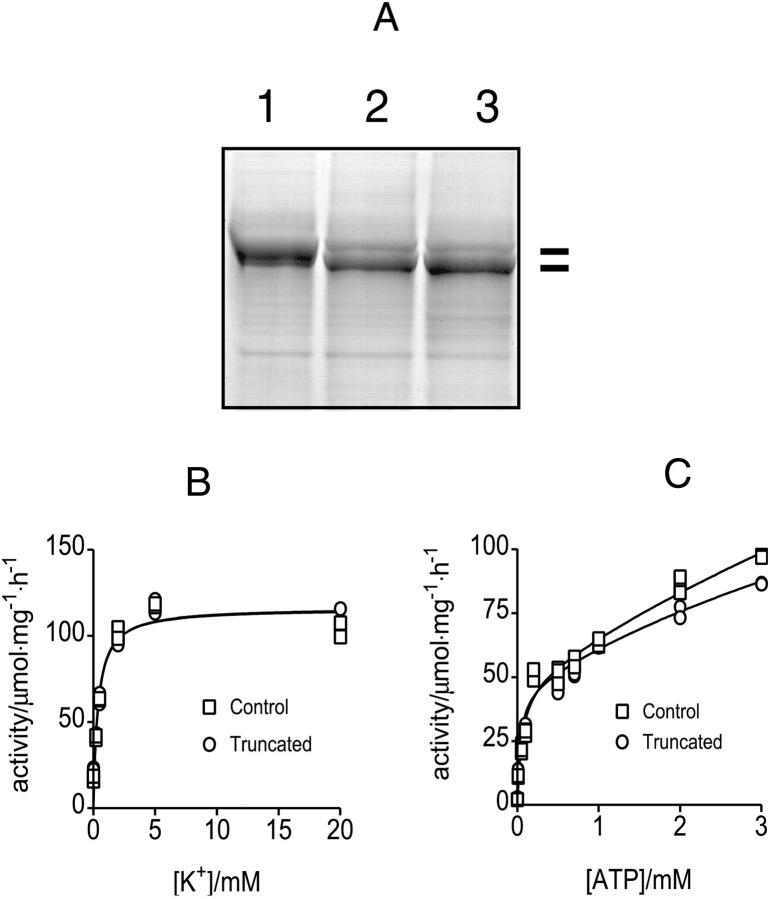
In this study we compared the protein kinase dependent regulation of gastric H,K-ATPase and Na,K-ATPase. The protein kinase A/protein kinase C (PKA/PKC) phosphorylation profile of H,K-ATPase was very similar to the one found in the Na,K-ATPase. PKC phosphorylation was taking place in the N-terminal part of the alpha-subunit with a stoichiometry of approximately 0.6 mol Pi/mole alpha-subunit. PKA phosphorylation was in the C-terminal part and required detergent, as is also found for the Na,K-ATPase. The stoichiometry of PKA-induced phosphorylation was approximately 0.7 mol Pi/mole alpha-subunit. Controlled proteolysis of the N-terminus abolished PKC phosphorylation of native H,K-ATPase. However, after detergent treatment additional C-terminal PKC sites became exposed located at the beginning of the M5M6 hairpin and at the cytoplasmic L89 loop close to the inner face of the plasma membrane. N-terminal PKC phosphorylation of native H,K-ATPase alpha-subunit was found to stimulate the maximal enzyme activity by 40-80% at saturating ATP, depending on pH. Thus, a direct modulation of enzyme activity by PKC phosphorylation could be demonstrated that may be additional to the well-known regulation of acid secretion by recruitment of H,K-ATPase to the apical membranes of the parietal cells. Moreover, a distinct difference in the regulation of H,K-ATPase and Na,K-ATPase is the apparent absence of any small regulatory proteins associated with the H,K-ATPase.


Figures

FIGURE 1
FIGURE 1
PKA and PKC phosphorylation profiles of gastric H,K-ATPase-containing microsomes. Autoradiogram of 32P-labeled proteins after SDS-gel electrophoresis showing PKA (lanes 1 and 2) and PKC (lanes 3 and 4) phosphorylation of pig gastric microsomes in the absence (lanes 1 and 3) or in the presence (lanes 2 and 4) of 0.1% Triton X-100. Membranes were incubated with protein kinase buffer, in the presence of 3 μCi/pmol [32P]ATP, as mentioned in Experimental Procedures. A total of 2 μg of phosphorylated proteins was separated by SDS-PAGE and visualized by autoradiography. The H,K-ATPase α-subunit was excised from the gel and the associated radioactivity measured by scintillation counting (Cornelius and Logvinenko, 1996). In the PKA profile with TX-100 (lane 2) the H,K-ATPase α-subunit, Rap 1A, and histone H3 are identified. In the PKC profile the H,K-ATPase α-subunit, PKC, and histone H1 are phosphorylated both in the absence and presence of Triton X-100, although the phosphorylation intensity of the H,K-ATPase α-subunit and the autophosphorylation of PKC are enhanced by detergent (see Fig. 4).
FIGURE 2
FIGURE 2
Comparison of the effects of sub-cmc concentrations of C12E8 on catalytic activity of Na,K-ATPase and H,K-ATPase. Pig stomach membranes were treated with 20 μM of C12E8 and the K+-activation curves were measured for control and C12E8 treated-membranes. The hydrolytic activity was measured as described in Methods. The reaction mixture contained 30 mM histidine, pH 7.00, 1 mM MgCl2, 0.3 μg protein, and the indicated KCl concentrations. Activities are expressed as percentage of maximum activity in controls.
FIGURE 3
FIGURE 3
N-terminal truncation of H,K-ATPase. A shows a Coomassie-stained SDS-PAGE demonstrating N-terminal truncation of the H,K-ATPase α-subunit by controlled proteolysis. Microsomes were incubated without (lane 1) or with (lanes 2 and 3) trypsin as described in Experimental Procedures. Lane 1, control; Lane 2, membranes were incubated in a proteolysis buffer, pH 7.2 containing 20 mM K+; Lane 3, membranes were incubated in a proteolysis buffer, pH 6.2, and in the absence of K+. Washed membranes were subjected to SDS-PAGE and the gel was stained with Coomassie blue. Representation of two independent experiments is shown. As seen, after mild proteolysis the mobility increases as a result of the N-terminal truncation. B shows K+ activation of control and N-terminal truncated enzyme in the presence of 3 mM ATP, pH 7.2. The fitted curves are hyperbolic with apparent K+ affinities of 0.36 ± 0.08 mM and 0.38 ± 0.09 mM, respectively. C shows ATP activation of H,K-ATPase before and after truncation at 20 mM K+, pH 7.2. In both cases the activation is biphasic with high-affinity apparent K0.5 ∼40 μM, and low-affinity components which saturated in the mM range.
FIGURE 4
FIGURE 4
PKA and PKC phosphorylation profiles of native and N-terminal truncated H,K-ATPase in the absence or presence of 0.1% Triton X-100. The upper panel shows autoradiogram of PKA phosphorylated H,K-ATPase preparations and the lower panel PKC phosphorylated H,K-ATPase preparations. Phosphorylated proteins were separated by SDS-PAGE and analyzed by autoradiography. The radioactivity associated with the α-subunits was measured by scintillation counting and the phosphorylation stoichiometry calculated as previously described (Cornelius and Logvinenko, 1996). For PKA phosphorylation the following phosphorylation stoichiometries were found (mol Pi/mol α): control-TX-100, 0.09 ± 0.014; control+TX-100, 0.71 ± 0.04; Truncated-TX-100, 0.018 ± 0.005; Truncated+TX-100, 0.30 ± 0.034. For PKC phosphorylation the stoichiometries were control-TX-100, 0.63 ± 0.01; control+TX-100, 1.16 ± 0.012; Truncated-TX-100, 0.13 ± 0.014; Truncated+TX-100, 0.43 ± 0.017.
FIGURE 5
FIGURE 5
Alignment of amino acid sequences of H,K-ATPase α-subunit N-terminus (upper) and C-terminus (lower) from different species. Putative phosphorylation sites are labeled with the respective amino acid number in the full-length mature protein. Sequences were obtained form GenBank. In the N-terminus a PKC site at Ser-27 is conserved. In the C-terminus, PKC sites at the M5M6 hairpin (Ser-785) and at the M8M9 loop (Thr-949) are conserved and in close apposition to the likewise conserved PKA site at Ser-953.
FIGURE 6
FIGURE 6
Proteolytic fingerprinting to localize C-terminal PKC phosphorylation. (A) An immunoblot using a specific H,K-ATPase α-subunit antibody of intact (left lane) and extensively trypsin treated (right lane) H,K-ATPase. Nearly all H,K-ATPase α-subunit is cleaved and several low molecular weight proteolytic products are probed with the antibody. (B) An autoradiogram showing proteolytic fingerprinting of PKC phosphorylated H,K-ATPase in the absence (left lane) or in the presence (right lane) of 0.1% TX-100. In the absence of TX-100 PKC phosphorylation is mainly associated with the 32-kDa N-terminal fragment, whereas in the presence of TX-100 additional phosphorylated fragments appear, most notably one at 19 kDa. A faint band migrating at an apparent molecular mass of 12 kDa is also observed. (C) Autoradiogram comparing PKA phosphorylation and PKC phosphorylation of H,K-ATPase in the absence (lanes 1 and 3) and presence (lanes 2 and 4) of 0.1% TX-100 after proteolytic fingerprinting. As seen, PKA and PKC phosphorylation are detected at a 19-kDa fragment and only in the presence of TX-100.
FIGURE 7
FIGURE 7
(A) Time course of PKC phosphorylation of H, K-ATPase. The figure shows the phosphorylation stoichiometry of PKC phosphorylation of H, K-ATPase as a function of time. PKC phosphorylation was performed as described in Methods except that the reaction was terminated after the indicated time intervals with SDS sample buffer containing 0.5% TCA. Volumes containing 2 μg protein were loaded onto the gel. After electrophoresis and autoradiography (shown as inset to the figure), the α bands were cut from the gel and counted for radioactivity. The phosphorylation stoichiometry was calculated as described in Methods. (B) Autoradiogram showing absence of endogenous phosphatase activity in H,K-ATPase preparation. A total of 4 μg of H, K-ATPase membranes were phosphorylated by PKC for 30 min at 24°C in the presence of 32P[ATP] as described in Methods. The reactions were then quenched with 2.5 mM cold ATP and the phosphorylated membranes mixed with increasing concentrations of unphosphorylated membranes (0, 1, 2, 3, and 4 μg as indicated in the figure) and incubated again for 30 min. The samples were then treated with SDS sample buffer and subjected to SDS-PAGE and autoradiography. The constant level of phosphorylation indicates the absence of phosphatase activity.
FIGURE 8
FIGURE 8
Steady-state K+ activation of hydrolytic activity at low ATP. H,K-ATPase membranes were incubated in PKC buffer at 24°C, pH 7.5, in the presence (□) or absence of PKC (○) for 30 min followed by measurement of the steady-state hydrolytic activity at variable K+ concentrations in the presence of 10 μM ATP in histidine buffer with the pH values adjusted to 6.5 or 7.2 as indicated. At both pH = 6.5 (A) and pH = 7.2 (B), identical K+ activation curves were obtained in control and after PKC phosphorylation. Note, however, the higher apparent K+-affinities (K0.5 ∼0.23 mM at pH 6.5 vs. 0.08 mM at pH 7.2) and the lower maximum hydrolytic activities (∼14 μmol·mg−1·h−1 at pH 6.5 vs. ∼7 μmol·mg−1·h−1 at pH 7.2) when pH increases.
FIGURE 9
FIGURE 9
Steady-state K+ activation of hydrolytic activity at high ATP. These experiments were performed by incubation of H,K-ATPase membranes in PKC buffer at 24°C in the presence (□) or absence of PKC (○) for 30 min followed by measurement of the maximum hydrolytic activity at variable K+ concentration at 3 mM ATP. Incubation of the enzyme with PKC at both pH 6.5 (A) and 7.2 (B) resulted in a significant activation of the hydrolytic activity. Curves represent fitting of the data with a hyperbolic binding curve. At pH 7.2 the maximum hydrolytic activity at 30°C was 63.5 ± 1.4 μmol·mg−1·h−1 in control experiments whereas in membranes pre-incubated with PKC the activity was 112.5 ± 1.2 μmol·mg−1·h−1 (P < 0.007). A similar activation was also observed at pH 6.2: 57.5 ± 1.9 μmol·mg−1·h−1 for control and 87.7 ± 1.4 μmol·mg−1·h−1 after PKC phosphorylation (P < 0.003). The fitted values for the K0.5 of K+-activation at pH 7.2 were 0.59 mM and 0.58 mM in control and after PKC phosphorylation, respectively. At pH 6.2 the K0.5 of K+-activation were identical 1.7 mM before and after PKC phosphorylation.
SCHEME 1
SCHEME 1
FIGURE 10
FIGURE 10
The steady-state ATP activation curve obtained at [K+] = 10 mM, pH 7.2 in control H,K-ATPase membranes (○) and after PKC phosphorylation (□). In control the activation is biphasic, whereas after PKC phosphorylation it becomes hyperbolic and the maximum hydrolytic activity increased significantly.

Similar articles

Cited by

References

    1. Asahi, M., Y. Kimura, K. Kurzydlowski, M. Tada, and D. H. MacLennan. 1999. Transmembrane helix M6 in Sarco(endo)plasmic reticulum Ca2+-ATPase forms a functional site with phospholamban. Evidence for a physical interaction at other sites. J. Biol. Chem. 274:32855–32862. - PubMed
    1. Baginski, E. S., P. P. Foa, and B. Zak. 1967. Determination of phosphate: study of labile organic phosphate interference. Clin. Chim. Acta. 14:155–158.
    1. Beguin, P., G. Crambert, S. Guennoun, H. Garty, J.-D. Horisberger, and K. Geering. 2001. CHIF, a member of the FXYD protein family, is a regulator of Na,K-ATPase distinct from the γ-subunit. EMBO J. 20:3993–4002. - PMC - PubMed
    1. Beguin, P., G. Crambert, F. Monnet-Tschudi, M. Uldry, J.-D. Horisberger, H. Garty, and K. Geering. 2002. FXYD7 is a brain-specific regulator of Na,K-ATPase α1-β isozymes. EMBO J. 21:3264–3273. - PMC - PubMed
    1. Beguin, P., X. Wang, D. Firsov, A. Puoti, D. Claeys, J.-D. Horisberger, and K. Geering. 1997. The γ subunit is a specific component of the Na,K-ATPase and modulates its transport function. EMBO J. 16:4250–4260. - PMC - PubMed

Publication types

MeSH terms