

Activation of hydrogen peroxide in horseradish peroxidase occurs within approximately 200 micro s observed by a new freeze-quench device
- PMID: 12609902
- PMCID: PMC1302769
- DOI: 10.1016/s0006-3495(03)75008-5
Activation of hydrogen peroxide in horseradish peroxidase occurs within approximately 200 micro s observed by a new freeze-quench device
Abstract
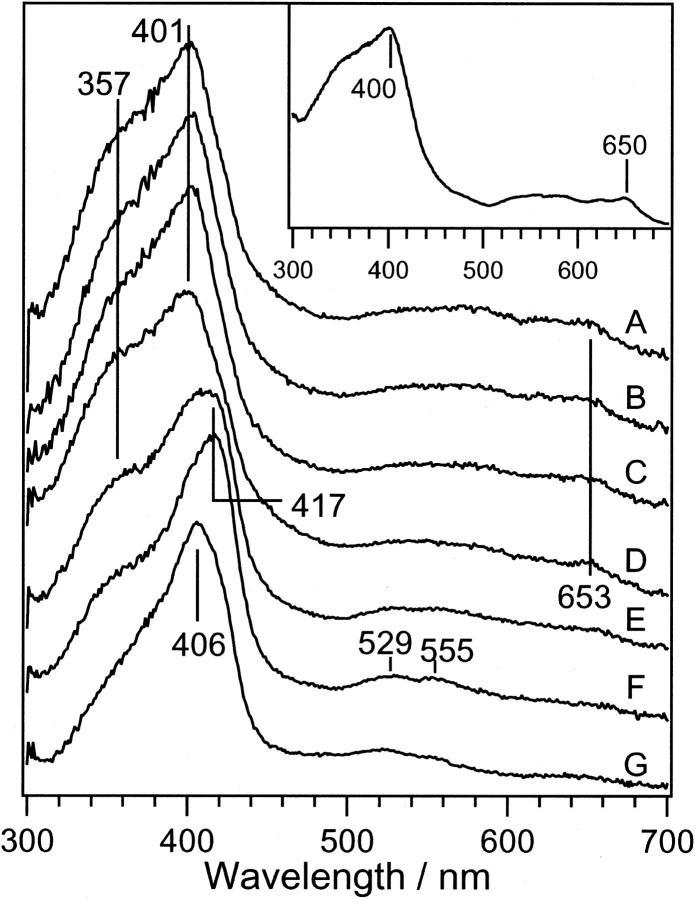
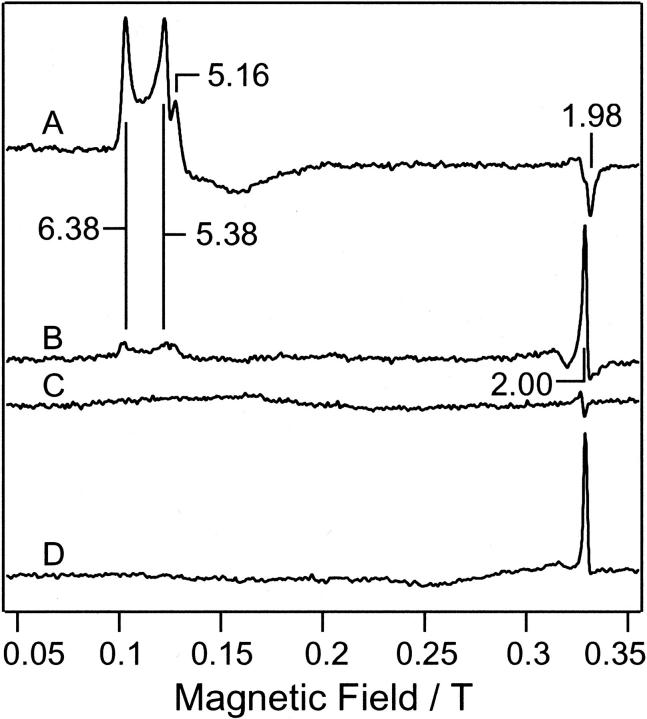
To observe the formation process of compound I in horseradish peroxidase (HRP), we developed a new freeze-quench device with approximately 200 micro s of the mixing-to-freezing time interval and observed the reaction between HRP and hydrogen peroxide (H(2)O(2)). The developed device consists of a submillisecond solution mixer and rotating copper or silver plates cooled at 77 K; it freezes the small droplets of mixed solution on the surface of the rotating plates. The ultraviolet-visible spectra of the sample quenched at approximately 1 ms after the mixing of HRP and H(2)O(2) suggest the formation of compound I. The electron paramagnetic resonance spectra of the same reaction quenched at approximately 200 micro s show a convex peak at g = 2.00, which is identified as compound I due to its microwave power and temperature dependencies. The absence of ferric signals in the electron paramagnetic resonance spectra of the quenched sample indicates that compound I is formed within approximately 200 micro s after mixing HRP and H(2)O(2). We conclude that the activation of H(2)O(2) in HRP at ambient temperature completes within approximately 200 micro s. The developed device can be generally applied to investigate the electronic structures of short-lived intermediates of metalloenzymes.
Figures


Similar articles
-
Electron paramagnetic resonance and ultraviolet/visible study of compounds I and II in the horseradish peroxidase-H(2)O(2)-silk fiber reaction system.Spectrochim Acta A Mol Biomol Spectrosc. 2003 Jun;59(8):1911-7. doi: 10.1016/s1386-1425(02)00434-1. Spectrochim Acta A Mol Biomol Spectrosc. 2003. PMID: 12736077
-
Oxidative and nonoxidative decarboxylation of N-Alkyl-N-phenylglycines by horseradish peroxidase. Mechanistic switching by varying hydrogen peroxide, oxygen, and solvent deuterium.Biochemistry. 2004 Jun 22;43(24):7907-14. doi: 10.1021/bi049499q. Biochemistry. 2004. PMID: 15196035
-
Characteristics of chemiluminescence observed in the horseradish peroxidase-hydrogen peroxide-tyrosine system.Arch Biochem Biophys. 1999 Sep 15;369(2):233-42. doi: 10.1006/abbi.1999.1360. Arch Biochem Biophys. 1999. PMID: 10486142
-
Mechanism of reaction of hydrogen peroxide with horseradish peroxidase: identification of intermediates in the catalytic cycle.J Am Chem Soc. 2001 Dec 5;123(48):11838-47. doi: 10.1021/ja011853+. J Am Chem Soc. 2001. PMID: 11724589
-
Microsecond freeze-hyperquenching: development of a new ultrafast micro-mixing and sampling technology and application to enzyme catalysis.Biochim Biophys Acta. 2004 May 12;1656(1):1-31. doi: 10.1016/j.bbabio.2004.02.006. Biochim Biophys Acta. 2004. PMID: 15136155 Review.
Cited by
-
Characterizing millisecond intermediates in hemoproteins using rapid-freeze-quench resonance Raman spectroscopy.Methods Mol Biol. 2014;1122:107-23. doi: 10.1007/978-1-62703-794-5_8. Methods Mol Biol. 2014. PMID: 24639256 Free PMC article.
-
Raman spectra of interchanging β-lactamase inhibitor intermediates on the millisecond time scale.J Am Chem Soc. 2013 Feb 27;135(8):2895-8. doi: 10.1021/ja311440p. Epub 2013 Feb 18. J Am Chem Soc. 2013. PMID: 23406484 Free PMC article.
-
Spectroscopic and Kinetic Characterization of Peroxidase-Like π-Cation Radical Pinch-Porphyrin-Iron(III) Reaction Intermediate Models of Peroxidase Enzymes.Molecules. 2016 Jun 27;21(7):804. doi: 10.3390/molecules21070804. Molecules. 2016. PMID: 27355940 Free PMC article.
-
Millisecond mix-and-quench crystallography (MMQX) enables time-resolved studies of PEPCK with remote data collection.IUCrJ. 2021 Aug 4;8(Pt 5):784-792. doi: 10.1107/S2052252521007053. eCollection 2021 Sep 1. IUCrJ. 2021. PMID: 34584739 Free PMC article.
-
Design, Implementation, Simulation, and Visualization of a Highly Efficient RIM Microfluidic Mixer for Rapid Freeze-Quench of Biological Samples.Appl Magn Reson. 2011 Feb 11;40(4):415-425. doi: 10.1007/s00723-011-0195-7. Appl Magn Reson. 2011. PMID: 22180701 Free PMC article.
References
-
- Aasa, D., T. Vänngård, and H. B. Dunford. 1975. ESR studies on compound I of horseradish peroxidase. Biochim. Biophys. Acta. 391:259–264. - PubMed
-
- Antonini, E. and M. Burunori. 1971. Hemoglobin and Myoglobin In Their Reactions with Ligands. American Elsevier Publishing Co., New York.
-
- Baek, H. K., and H. E. Van Wart. 1989. Elementary steps in the formation of horseradish peroxidase compound I: direct observation of compound 0, a new intermediate with a hyperporphyrin spectrum. Biochemistry 28:5714–5719. - PubMed
-
- Baek, H. K. and H. E. Van Wart. 1992. Elementary steps in the reaction of horseradish peroxidase with several peroxides: kinetic and thermodynamics of formation of compound 0 and compound I. J. Am. Chem. Soc. 114:718–725.
-
- Bald, W. D. 1985. The relative merits of various cooling methods. J. Microsc. 140:17–40.
Publication types
MeSH terms
Substances
LinkOut - more resources
Full Text Sources
