. 2003 Mar 4;100(5):2532-7.
doi: 10.1073/pnas.0533805100. Epub 2003 Feb 27.

Molecular classification of familial non-BRCA1/BRCA2 breast cancer

Affiliations

Molecular classification of familial non-BRCA1/BRCA2 breast cancer

Ingrid Hedenfalk et al. Proc Natl Acad Sci U S A. .

Abstract

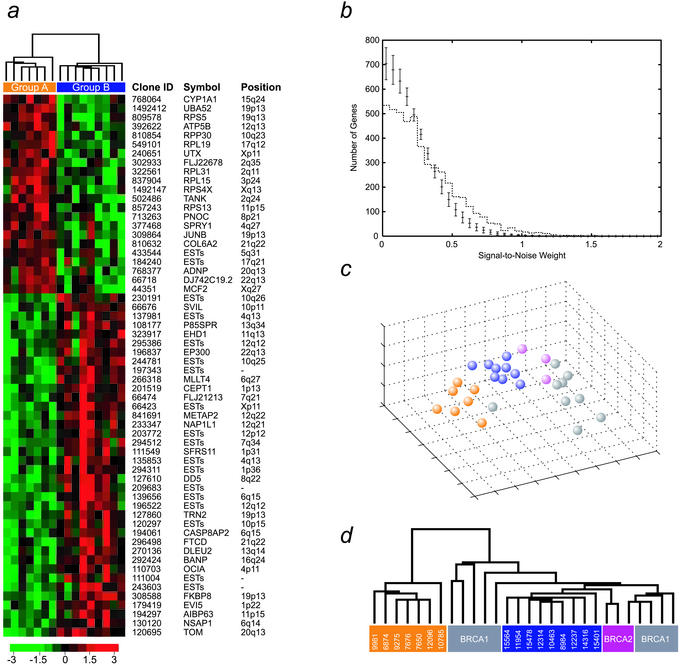
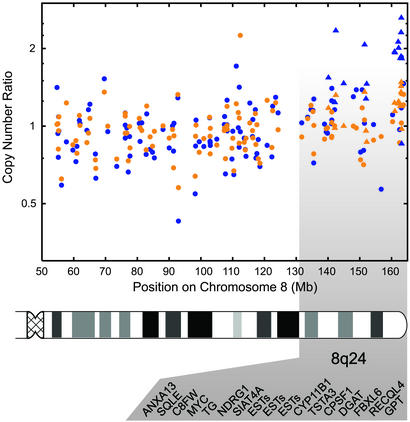
In the decade since their discovery, the two major breast cancer susceptibility genes BRCA1 and BRCA2, have been shown conclusively to be involved in a significant fraction of families segregating breast and ovarian cancer. However, it has become equally clear that a large proportion of families segregating breast cancer alone are not caused by mutations in BRCA1 or BRCA2. Unfortunately, despite intensive effort, the identification of additional breast cancer predisposition genes has so far been unsuccessful, presumably because of genetic heterogeneity, low penetrance, or recessive/polygenic mechanisms. These non-BRCA1/2 breast cancer families (termed BRCAx families) comprise a histopathologically heterogeneous group, further supporting their origin from multiple genetic events. Accordingly, the identification of a method to successfully subdivide BRCAx families into recognizable groups could be of considerable value to further genetic analysis. We have previously shown that global gene expression analysis can identify unique and distinct expression profiles in breast tumors from BRCA1 and BRCA2 mutation carriers. Here we show that gene expression profiling can discover novel classes among BRCAx tumors, and differentiate them from BRCA1 and BRCA2 tumors. Moreover, microarray-based comparative genomic hybridization (CGH) to cDNA arrays revealed specific somatic genetic alterations within the BRCAx subgroups. These findings illustrate that, when gene expression-based classifications are used, BRCAx families can be grouped into homogeneous subsets, thereby potentially increasing the power of conventional genetic analysis.


Figures

Figure 1
Figure 1
Gene expression-based class discovery of BRCAx breast cancers. (a) Based on 16 BRCAx tumors, the most significant separation into two classes (see Materials and Methods) resulted in classes with seven (group A, yellow) and nine (group B, blue) samples, respectively. Group A consists of families L5, L16, and L99, and group B of families L101, L111, L414, L502, and L505 (see Table 1). Sixty statistically significant genes (P < 0.001), which were found to separate the groups, are listed. Expression levels for each gene are normalized across the samples such that the mean is 0 and the variance is 1. Expression levels greater than the mean are pseudocolored red, and those below are pseudocolored green. The scale indicates SDs above or below the mean. (b) The number of genes separating BRCAx cancers into two subgroups (dotted line) is plotted as a function of the signal-to-noise weight. The bars (1 SD) show the number of genes expected by chance. There is a clear overabundance of genes separating the BRCAx subgroups. (c and d) Based on the 60 genes that best separated BRCAx tumors into two groups, multidimensional scaling analysis and hierarchical clustering of the 16 samples together with BRCA1 (gray) and BRCA2 (purple) tumors is shown. The BRCAx subgroups were separated from one another as well as from the BRCA1 and BRCA2 tumors, reflecting the difference between BRCAx and BRCA1/2 tumors.
Figure 2
Figure 2
cDNA microarray-based CGH analysis of chromosome 8q in BRCAx subgroups. Average copy number ratios for group A (yellow) and group B (blue) are shown for clones on chromosome 8q. The position of the clones on chromosome 8 is shown in Mbs from the 8p telomere, as given by alignment to the draft human genome sequence (see Materials and Methods). Seventeen clones on 8q24 that were found to be different (α < 0.05) in copy number ratio between groups A and B are listed in positional order below and are highlighted (triangle). All but one (RECQL4) had higher ratios in group B than in group A.

References

    1. Ford D, Easton D F, Stratton M, Narod S, Goldgar D, Devilee P, Bishop D T, Weber B, Lenoir G, Chang-Claude J, et al. Am J Hum Genet. 1998;62:676–689. - PMC - PubMed
    1. Seitz S, Rohde K, Bender E, Nothnagel A, Kolble K, Schlag P M, Scherneck S. Oncogene. 1997;14:741–743. - PubMed
    1. Kainu T, Juo S H, Desper R, Schaffer A A, Gillanders E, Rozenblum E, Freas-Lutz D, Weaver D, Stephan D, Bailey-Wilson J, et al. Proc Natl Acad Sci USA. 2000;97:9603–9608. - PMC - PubMed
    1. Rahman N, Teare M D, Seal S, Renard H, Mangion J, Cour C, Thompson D, Shugart Y, Eccles D, Devilee P, et al. Oncogene. 2000;19:4170–4173. - PubMed
    1. Thompson D, Szabo C I, Mangion J, Oldenburg R A, Odefrey F, Seal S, Barfoot R, Kroeze-Jansema K, Teare D, Rahman N, et al. Proc Natl Acad Sci USA. 2002;99:827–831. - PMC - PubMed

Publication types