. 2003 Apr 1;548(Pt 1):31-7.
doi: 10.1113/jphysiol.2003.040048. Epub 2003 Feb 28.

Acute hypoxia occludes hTREK-1 modulation: re-evaluation of the potential role of tandem P domain K+ channels in central neuroprotection

Affiliations

Acute hypoxia occludes hTREK-1 modulation: re-evaluation of the potential role of tandem P domain K+ channels in central neuroprotection

P Miller et al. J Physiol. .

Abstract

The human tandem P domain K+ channel hTREK-1 (KCNK2) is distributed widely through the CNS. Here, whole-cell patch clamp recordings were employed to investigate the effects of hypoxia on hTREK-1 channels stably expressed in human embryonic kidney cells. Acute hypoxia caused a rapid and reversible inhibition of whole-cell K+ current amplitudes; this was PO2 dependent with a maximal inhibition achieved at 60 mmHg and below. In accordance with previous studies, hTREK-1 current amplitudes were enhanced by arachidonic acid. This effect was concentration dependent, with maximal enhancement observed at a concentration of 10 microM. Membrane deformation by the crenator trinitrophenol (to mimic cell swelling) or the cup former chlorpromazine (to mimic cell shrinkage) caused robust activation and inhibition of currents, respectively. However, current augmentation by either arachidonic acid or trinitrophenol was completely prevented during hypoxia; conversely, hypoxia blunted the inhibitory action of chlorpromazine. The abilities of arachidonic acid to augment currents and of hypoxia to completely abrogate this effect were also observed in cell-attached patches. Our data indicate that hypoxia interacts with hTREK-1, and occludes its modulation by arachidonic acid and membrane deformation. These findings also suggest that the potential neuroprotective role of TREK channels, which has recently been proposed, requires reconsideration since hTREK-1 activation is unlikely when ambient PO2 is below 60 mmHg - a situation which normally pertains in the CNS even during systemic normoxia.


Figures
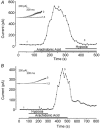
Figure 4
Figure 4. hTREK1 modulation in the cell-attached configuration
A, example time series plot of current amplitude determined using a cell-attached recording and measured at a pipette potential of −130 mV (assumed to be +60 mV if membrane potential is taken as −70 mV). Periods of exposure to 10 μm AA, and to hypoxia in the continued presence of AA, are indicated by the horizontal bars. Numbered current traces in the inset correspond to the numbered points on the time series. B, as A, except that the cell was initially exposed to both hypoxia and 10 μm AA, then to AA under normoxic conditions. Numbered current traces in the inset correspond to the numbered points on the time series.
Figure 1
Figure 1. Recombinant hTREK-1 is O2 sensitive when expressed in HEK 293 cells
A, exemplar whole-cell currents evoked by the ramp-step protocol shown in the lower panel of D during perfusion of normoxic control solution (C), in the presence of 10 μm arachidonic acid (AA), and during washout (W) as indicated. B, as A, except that the cell was exposed to perfusate containing TNP (400 μm) rather than AA. C, as A except that the cell was exposed to perfusate containing CPZ (10 μm) rather than AA. D, exemplar whole-cell currents evoked by the ramp-step protocol shown before (C), during (H) and after (W) exposure to hypoxic solution, in hTREK-1 transfected HEK 293 cells (upper traces) and wild-type HEK 293 cells (lower traces). Shown below these traces is the ramp-step protocol used to evoke all currents illustrated. E, plot of normalised current amplitudes (I/Imax) versus chamber PO2 levels (on a log10 scale). At each PO2 level examined, the fractional inhibition (observed during a hypoxic challenge from 150 mmHg to the PO2 level shown) is plotted for individual cells (○), and the mean effect is indicated by the horizontal bars. The line was drawn by eye.
Figure 2
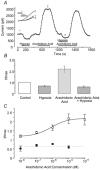
Figure 2. Hypoxia occludes arachidonic acid activation of hTREK-1
A, typical time-series plot of current amplitude measured at +60 mV showing the effects of hypoxia, and AA (10 μm) in the presence and absence of hypoxia (∼ 20 mmHg). Periods of exposure to AA and hypoxic perfusate are indicated by the horizontal bars. Numbered current traces in the inset correspond to the numbered points on the time series. B, mean, normalised current amplitudes recorded at +60 mV in control (normoxic) solutions and in the conditions indicated beneath each bar. C, concentration-response curves for AA-evoked, normalised whole-cell currents under normoxic (□) and hypoxic (▪) conditions. Each point plots mean, normalised current enhancement (with vertical s.e.m. bars, taken from 5–7 cells) due to exposure to varying AA concentrations. The dotted line indicates the mean normalised current amplitude evoked by hypoxia alone (taken from B).
Figure 3
Figure 3. Hypoxia occludes modulation of hTREK-1 by chlorpromazine and trinitrophenol
A, typical time series plot of current amplitude measured at +60 mV showing the effects of TNP in normoxia, and the complete reversal of its effects by hypoxia. Periods of exposure to TNP and hypoxic perfusate indicated by the horizontal bars. Numbered current traces in the inset correspond to the numbered points on the time series. B, mean, normalised current amplitudes recorded at +60 mV in control (normoxic) solutions and in the conditions indicated beneath each bar. C, typical time series plot of current amplitude measured at +60 mV showing the effects of hypoxia and of CPZ in the presence and absence of hypoxia. Periods of exposure to CPZ and hypoxic perfusate indicated by the horizontal bars. Numbered current traces in the inset correspond to the numbered points on the time series. D, mean, normalised current amplitudes recorded at +60 mV in control (normoxic) solutions and in the conditions indicated beneath each bar.

Similar articles

Cited by

References

    1. Bang H, Kim Y, Kim D. TREK-2, a new member of the mechanosensitive tandem-pore K+ channel family. J Biol Chem. 2000;275:17412–17419. - PubMed
    1. Buckler KJ, Williams BA, Honore E. An oxygen-, acid- and anaesthetic-sensitive TASK-like background potassium channel in rat arterial chemoreceptor cells. J Physiol. 2000;525:135–142. - PMC - PubMed
    1. Duprat F, Lesage F, Patel AJ, Fink M, Romey G, Lazdunski M. The neuroprotective agent riluzole activates the two P domain K+ channels TREK-1 and TRAAK. Mol Pharmacol. 2000;57:906–912. - PubMed
    1. Fearon IM, Varadi G, Koch S, Isaacsohn I, Ball SG, Peers C. Splice variants reveal the region involved in oxygen sensing by recombinant human L-type Ca2+ channels. Circ Res. 2000;87:537–539. - PubMed
    1. Fink M, Duprat F, Lesage F, Reyes R, Romey G, Heurteaux C, Lazdunski M. Cloning, functional expression and brain localization of a novel unconventional outward rectifier K+ channel. EMBO J. 1996;15:6854–6862. - PMC - PubMed

Publication types

MeSH terms

LinkOut - more resources