

Force generation induced by rapid temperature jumps in intact mammalian (rat) skeletal muscle fibres
- PMID: 12611915
- PMCID: PMC2342845
- DOI: 10.1113/jphysiol.2002.037143
Force generation induced by rapid temperature jumps in intact mammalian (rat) skeletal muscle fibres
Abstract
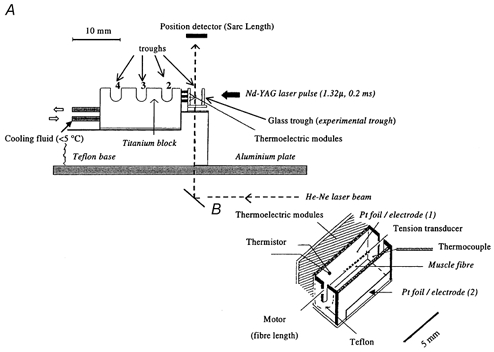
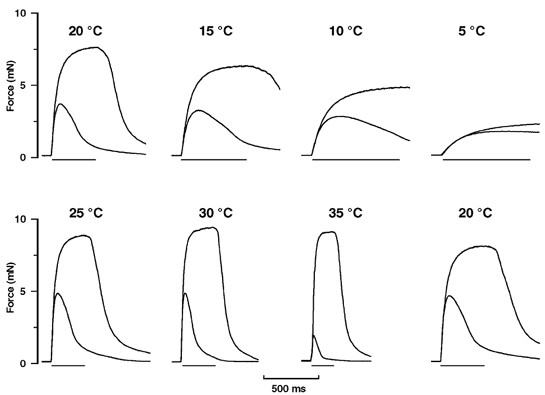
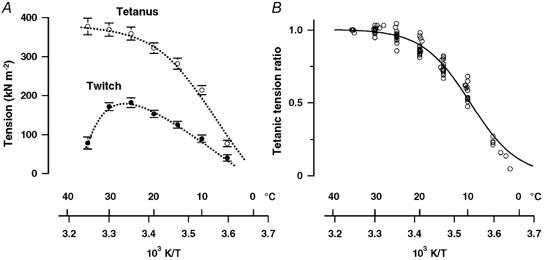
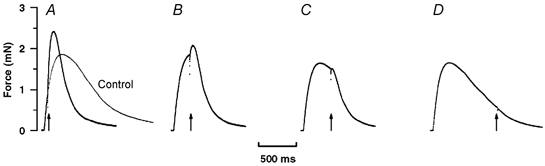
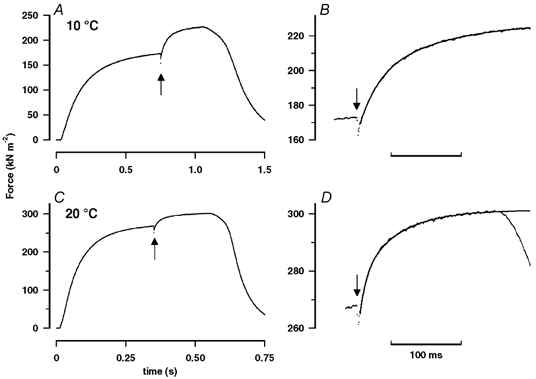
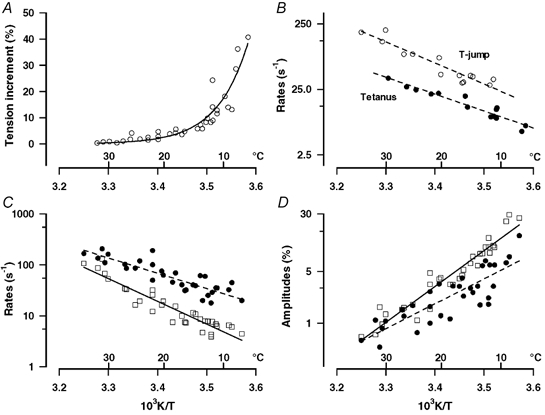
We examined the tension (force) responses induced by rapid temperature jumps (T-jumps) in electrically stimulated, intact fibre bundles (5-10 fibres, fibre length approximately 2 mm) isolated from a foot muscle (flexor hallucis brevis) of the rat; the muscle contains approximately 90 % type 2 fast fibres. In steady state experiments, the temperature dependence of the twitch tension was basically similar to that previously described from other fast muscles; the tetanic tension increased 3- to 4-fold in raising the temperature from approximately 2 to 35 degrees C and the relation between the tetanic tension and the reciprocal absolute temperature was sigmoidal with half-maximal tension at 9.5 degrees C. A rapid T-jump of 3-5 degrees C was induced during a contraction by applying an infrared laser pulse (lambda = 1.32 micro, 0.2 ms) to the 50 microl trough containing the fibre bundle immersed in physiological saline. At approximately 10 degrees C, a T-jump induced a large transient tension rise when applied during the rising phase of a twitch contraction, the amplitude of which decreased when the T-jump was delayed with respect to the stimulus; a T-jump probably perturbs an early step in excitation-contraction coupling. No transient increase was seen when a T-jump was applied during twitch relaxation. When applied during the plateau of a tetanic contraction a T-jump induced a tension rise to a higher steady tension level; the tension rise after a T-jump was 2-3 times faster than the corresponding phase of the initial tension rise in a tetanus. The approach to a new steady tension level after a T-jump was biphasic with a fast (phase 2b, approximately 35 s-1 at 10 degrees C) and a slow component (phase 3, < 10 s-1). The rates of both components increased (Q10 approximately 3) but their amplitudes decreased with increase of the steady temperature. These results from tetanized intact fibres are consistent with the thesis previously proposed from studies on Ca2+-activated skinned fibres, that the elementary force generation step in muscle is enhanced by increased temperature; the findings indicate that an endothermic molecular step underlies muscle force generation.
Figures
Similar articles
-
Tension responses to rapid (laser) temperature-jumps during twitch contractions in intact rat muscle fibres.J Muscle Res Cell Motil. 2005;26(2-3):113-22. doi: 10.1007/s10974-005-4568-0. Epub 2005 Jul 1. J Muscle Res Cell Motil. 2005. PMID: 16001130
-
Endothermic force generation, temperature-jump experiments and effects of increased [MgADP] in rabbit psoas muscle fibres.J Physiol. 2005 Sep 1;567(Pt 2):471-92. doi: 10.1113/jphysiol.2005.090084. Epub 2005 Jun 23. J Physiol. 2005. PMID: 15975981 Free PMC article.
-
Endothermic force generation in skinned cardiac muscle from rat.J Muscle Res Cell Motil. 1999 Aug;20(5-6):489-96. doi: 10.1023/a:1005509731881. J Muscle Res Cell Motil. 1999. PMID: 10555067
-
Force generation simplified. Insights from laser temperature-jump experiments on contracting muscle fibers.Adv Exp Med Biol. 1998;453:343-51; discussion 351-2. Adv Exp Med Biol. 1998. PMID: 9889846 Review.
-
Force and power generating mechanism(s) in active muscle as revealed from temperature perturbation studies.J Physiol. 2010 Oct 1;588(Pt 19):3657-70. doi: 10.1113/jphysiol.2010.194001. J Physiol. 2010. PMID: 20660565 Free PMC article. Review.
Cited by
-
Pre-hibernation diet alters skeletal muscle relaxation kinetics, but not force development in torpid arctic ground squirrels.J Comp Physiol B. 2024 Feb;194(1):65-79. doi: 10.1007/s00360-023-01527-z. Epub 2024 Jan 14. J Comp Physiol B. 2024. PMID: 38219236 Free PMC article.
-
Comparison of the tension responses to ramp shortening and lengthening in intact mammalian muscle fibres: crossbridge and non-crossbridge contributions.J Muscle Res Cell Motil. 2007;28(2-3):123-39. doi: 10.1007/s10974-007-9110-0. Epub 2007 Jul 4. J Muscle Res Cell Motil. 2007. PMID: 17610136
-
Temperature jump induced force generation in rabbit muscle fibres gets faster with shortening and shows a biphasic dependence on velocity.J Physiol. 2010 Feb 1;588(Pt 3):479-93. doi: 10.1113/jphysiol.2009.179200. Epub 2009 Nov 30. J Physiol. 2010. PMID: 19948657 Free PMC article.
-
Temperature change as a probe of muscle crossbridge kinetics: a review and discussion.Proc Biol Sci. 2009 Aug 7;276(1668):2685-95. doi: 10.1098/rspb.2009.0177. Epub 2009 Apr 8. Proc Biol Sci. 2009. PMID: 19364742 Free PMC article. Review.
-
The Mechanism of Modulation of Cardiac Force by Temperature.Int J Mol Sci. 2025 Jan 8;26(2):469. doi: 10.3390/ijms26020469. Int J Mol Sci. 2025. PMID: 39859186 Free PMC article.
References
-
- Armstrong RB, Phelps RO. Muscle fiber type composition of the rat hind limb. Am J Anat. 1984;171:259–272. - PubMed
-
- Bershitsky SY, Tsaturyan AK, Bershitskaya ON, Mashanov GI, Brown P, Burns R, Ferenczi MA. Muscle force is generated by myosin heads stereospecifically attached to actin. Nature. 1997;388:188–190. - PubMed
Publication types
MeSH terms
LinkOut - more resources
Full Text Sources
Miscellaneous