D-Serine differently modulates NMDA receptor function in rat CA1 hippocampal pyramidal cells and interneurons
- PMID: 12611916
- PMCID: PMC2342854
- DOI: 10.1113/jphysiol.2002.037127
D-Serine differently modulates NMDA receptor function in rat CA1 hippocampal pyramidal cells and interneurons
Abstract
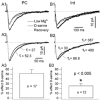
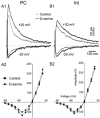
The organization of the neuronal hippocampal network depends on the tightly regulated interaction between pyramidal cells (PCs) and interneurons (Ints). NMDA receptor (NMDAR) activation requires the binding of glutamate and co-activation of the 'glycine site'. It has been reported that D-serine is a more potent endogenous agonist than glycine for that site. While many studies have focused on NMDAR function in PCs, little is known regarding the modulation of NMDARs in Ints. We studied the modulatory effect of D-serine on NMDAR EPSCs in PCs and in stratum radiatum Ints using whole-cell patch-clamp recording in rat acute hippocampal slices. We found that D-serine enhances NMDAR function and differently modulates NMDAR currents in both cell types. The augmentation of NMDAR currents by D-serine was significantly larger in PCs compared with Ints. Moreover, we found differences in the kinetics of NMDAR currents in PCs and Ints. Our findings indicate that regulation of NMDAR through the 'glycine site' depends on the cell types. We speculate that the observed differences arise from assemblies of diverse NMDAR subunits. Overall, our data suggest that D-serine may be involved in regulation of the excitation-inhibition balance in the CA1 hippocampal region.
Figures


Similar articles
-
Glycine transporter type 1 blockade changes NMDA receptor-mediated responses and LTP in hippocampal CA1 pyramidal cells by altering extracellular glycine levels.J Physiol. 2004 Jun 1;557(Pt 2):489-500. doi: 10.1113/jphysiol.2004.063321. Epub 2004 Apr 2. J Physiol. 2004. PMID: 15064326 Free PMC article.
-
D-serine relieves chronic lead exposure-impaired long-term potentiation in the CA1 region of the rat hippocampus in vitro.Neurosci Lett. 2007 May 1;417(2):118-22. doi: 10.1016/j.neulet.2007.01.085. Epub 2007 Mar 15. Neurosci Lett. 2007. PMID: 17408856
-
Role of the glycine site of the N-methyl-D-aspartate receptor in synaptic plasticity induced by pairing.Eur J Neurosci. 2005 May;21(10):2782-92. doi: 10.1111/j.1460-9568.2005.04099.x. Eur J Neurosci. 2005. PMID: 15926925
-
Time and space profiling of NMDA receptor co-agonist functions.J Neurochem. 2015 Oct;135(2):210-25. doi: 10.1111/jnc.13204. Epub 2015 Aug 3. J Neurochem. 2015. PMID: 26088787 Review.
-
Glycine site agonists of the N-methyl-D-aspartate receptor and Parkinson's disease: a hypothesis.Mov Disord. 2013 Apr;28(4):419-24. doi: 10.1002/mds.25306. Epub 2013 Feb 20. Mov Disord. 2013. PMID: 23427107 Review.
Cited by
-
Selective Pharmacological Modulation of Pyramidal Neurons and Interneurons in the CA1 Region of the Rat Hippocampus.Front Pharmacol. 2013 Mar 13;4:24. doi: 10.3389/fphar.2013.00024. eCollection 2013. Front Pharmacol. 2013. PMID: 23493925 Free PMC article.
-
Targeted disruption of serine racemase affects glutamatergic neurotransmission and behavior.Mol Psychiatry. 2009 Jul;14(7):719-27. doi: 10.1038/mp.2008.130. Epub 2008 Dec 9. Mol Psychiatry. 2009. PMID: 19065142 Free PMC article.
-
Reduced glycine transporter type 1 expression leads to major changes in glutamatergic neurotransmission of CA1 hippocampal neurones in mice.J Physiol. 2005 Mar 15;563(Pt 3):777-93. doi: 10.1113/jphysiol.2004.080655. Epub 2005 Jan 20. J Physiol. 2005. PMID: 15661817 Free PMC article.
-
NMDA NR2A and NR2B receptors in the rostral anterior cingulate cortex contribute to pain-related aversion in male rats.Pain. 2009 Nov;146(1-2):183-93. doi: 10.1016/j.pain.2009.07.027. Epub 2009 Aug 19. Pain. 2009. PMID: 19695778 Free PMC article.
-
Gene knockout of glycine transporter 1: characterization of the behavioral phenotype.Proc Natl Acad Sci U S A. 2004 Jun 1;101(22):8485-90. doi: 10.1073/pnas.0402662101. Epub 2004 May 24. Proc Natl Acad Sci U S A. 2004. PMID: 15159536 Free PMC article.
References
-
- Amaral DG, Witter MP. The three dimensional organization of the hippocampal formation: a review of anatomical data. Neuroscience. 1989;32:571–591. - PubMed
-
- Andrade R. Blockade of neurotransmitter-activated K+ conductance by QX-314 in the rat hippocampus. Eur J Pharmacol. 1991;199:259–262. - PubMed
-
- Ballard TM, Pauly-Evers M, Higgins GA, Ouagazzal A-M, Mutel V, Borroni E, Kemp JA, Bluethmann H, Kew JMC. Severe impairment of NMDA receptor function in mice carrying targeted point mutations in the glycine binding site results in drug-resistant nonhabituating hyperactivity. J Neurosci. 2002;22:6723–6723. - PMC - PubMed
Publication types
MeSH terms
Substances
LinkOut - more resources
Full Text Sources
Miscellaneous

