. 2003 Jul;90(1):333-41.
doi: 10.1152/jn.00715.2002. Epub 2003 Feb 26.

Propagating wave and irregular dynamics: spatiotemporal patterns of cholinergic theta oscillations in neocortex in vitro

Affiliations

Propagating wave and irregular dynamics: spatiotemporal patterns of cholinergic theta oscillations in neocortex in vitro

Weili Bao et al. J Neurophysiol. 2003 Jul.

Abstract

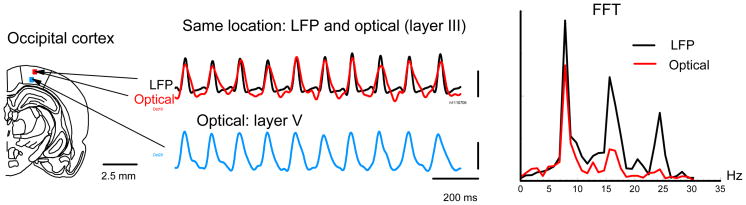
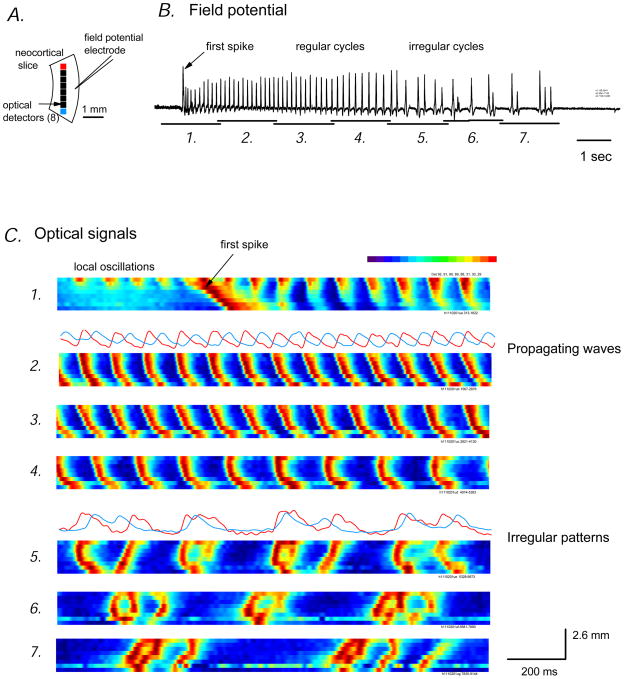
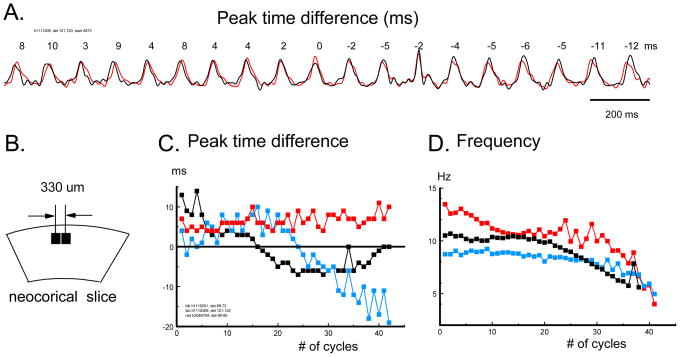
Neocortical "theta" oscillation (5-12 Hz) has been observed in animals and human subjects but little is known about how the oscillation is organized in the cortical intrinsic networks. Here we use voltage-sensitive dye and optical imaging to study a carbachol/bicuculline induced theta ( approximately 8 Hz) oscillation in rat neocortical slices. The imaging has large signal-to-noise ratio, allowing us to map the phase distribution over the neocortical tissue during the oscillation. The oscillation was organized as spontaneous epochs and each epoch was composed of a "first spike," a "regular" period (with relatively stable frequency and amplitude), and an "irregular" period (with variable frequency and amplitude) of oscillations. During each cycle of the regular oscillation, one wave of activation propagated horizontally (parallel to the cortical lamina) across the cortical section at a velocity of approximately 50 mm/s. Vertically the activity was synchronized through all cortical layers. This pattern of one propagating wave associated with one oscillation cycle was seen during all the regular cycles. The oscillation frequency varied noticeably at two neighboring horizontal locations (330 microm apart), suggesting that the oscillation is locally organized and each local oscillator is about </=300 microm wide horizontally. During irregular oscillations, the spatiotemporal patterns were complex and sometimes the vertical synchronization decomposed, suggesting a de-coupling among local oscillators. Our data suggested that neocortical theta oscillation is sustained by multiple local oscillators. The coupling regime among the oscillators may determine the spatiotemporal pattern and switching between propagating waves and irregular patterns.


Figures

Figure 1
Figure 1
left: Schematic diagram of the preparation and recording arrangement. Slices containing occipital cortex were sectioned from bregma -3 to -5 mm. A tungsten microelectrode was used to record local field potential (LFP) from cortical layer II-III. Voltage-sensitive dye signals from the tissue surrounding the electrode (a volume of 330 × 330 × 450 μm3, red square) were simultaneously recorded. Center: In layer II-III, simultaneous electrical (black) and optical (red) recordings had a similar waveform during the oscillations. In layer V, the optical signal (blue) has the same polarity. Calibration bar: -50 μV for LFP and 10−4 for optical recordings. Right: Power spectra of electrical (black) and optical (red) signals showed the same main peak at about 7.8 Hz during a sample piece (~20 cycles) of oscillations.
Figure 2
Figure 2
Spatial-temporal patterns of a spontaneous oscillation epoch. A. Recording arrangement. Signals from eight optical detectors in deep cortical layers were used in (C). A local field potential microelectrode was placed in layers II-III and recorded simultaneously with the optical imaging. B. An oscillation epoch recorded by the local field potential electrode. The epoch started spontaneously with a large first spike (i) and followed by regular and irregular cycles. Optical signals during the period 1– 7 (marked under the trace) of this epoch were shown in (C). C. Pseudo-color images composed from optical signals recorded by eight detectors arranged horizontally (shown in A). The optical signal from each detector was normalized to the maximum on that detector during that period and normalized values were assigned to colors according to a linear color scale (at the top right of C, 256 colors). The red and blue traces on top of the images C2 and C5 are optical signals from two optical detectors labeled red and blue in (A). The X direction of the images is the time (~12 seconds) and the Y direction of each image represents ~2.6 mm of space in cortical tissue. Note also that the first spike (i) had high amplitude but propagated slower in the tissue.
Figure 3
Figure 3
A. Propagating wave during the oscillation. Top trace: Oscillation recorded from one optical detector in cortical layer V. The location of the detector is indicated by the small square in the images. Bottom: Pseudo-color images synthesized from recordings of many optical detectors. The white broken lines mark the boundaries of the slice (Orientation: left, white matter; right, pia; top, medial, bottom, temporal). The images were one-millisecond snap-shots chosen at times marked by the vertical broken lines. B. Distribution of peak-time differences during 93 cycles of oscillation (two slices from two animals). The bar chart is made from 3162 measurements from 16 horizontal and 18 vertical pairs of measured points, all with a center-to-center distance of 330 μm. Y-axis: percentage of occurrences; X-axis: delay time in ms. The envelope lines were generated by low pass filtering of the bar chart data.
Figure 4
Figure 4
Evidence of locally controlled frequency. A: Oscillation cycles recorded from two neighboring optical detectors (red and black traces) with a horizontal separation of 330 μm (Schematic diagram in B). The numbers on top of each cycle is the peak-time difference of that cycle. The peak-time difference decreased with time, from +8 ms to -12 ms, indicating that the frequency at one location (black) declined faster than that of the other the location (red). C: Variations of peak-time difference of three pairs of optical detectors (schematic in B) during regular oscillation cycles (from three animals). D: Cycle-to-cycle variation of the frequency during the same periods as that shown in C .
Figure 5
Figure 5
Examples of irregular oscillations. Panels AD are from 4 different animals. In each panel all images were from the same epoch, however only part of regular and part of irregular cycles were shown. Images C3, C5, D3 and D5 were from 5 vertically arranged detectors (total 1.65 mm wide) between layers II (top) to VI (bottom), showing the vertical coupling during the same periods of images C2, C4, D2 and D4 respectively. The rest of the images were from 10 detectors horizontally arranged (total 3.3 mm wide) in cortical layers II-III. Each image showed a period of 12 seconds. Pseudo color scale was linear, same as that for Figure 2. See text for the descriptions of the patterns.
Figure 6
Figure 6
Vertical de-synchronization. A. Top trace: Local field potential recording of one epoch of oscillation. VSD imaging revealed periods of propagating waves (P) and Irregular oscillations (I). R: activation with reversed propagation direction (data not shown). The period X is shown in detail in 4B. Bottom traces: VSD signals in layer II-III and V during different periods of the epoch. B. During irregular oscillations the vertical synchrony decreased. VSD signals from different layers and locations showed different peak time and patterns.

References

    1. Bal T, Von Krosigk M, McCormick DA. Synaptic and membrane mechanisms underlying synchronized oscillations in the ferret lateral geniculate nucleus in vitro. J Physiol. 1995;483:641–63. - PMC - PubMed
    1. Benardo LS, Prince DA. Cholinergic pharmacology of mammalian hippocampal pyramidal cells. Neuroscience. 1982;7:1703–12. - PubMed
    1. Bilkey DK, Goddard GV. Medial septal facilitation of hippocampal granule cell activity is mediated by inhibition of inhibitory interneurones. Brain Res. 1985;361:99–106. - PubMed
    1. Bragin A, Jando G, Nadasdy Z, Hetke J, Wise K, Buzsaki G. Gamma (40–100 Hz) oscillation in the hippocampus of the behaving rat. J Neurosci. 1995;15:47–60. - PMC - PubMed
    1. Buzsaki G. Theta oscillations in the hippocampus. Neuron. 2002;33:325–40. - PubMed

Publication types

LinkOut - more resources