. 2003 Mar;23(6):1961-7.
doi: 10.1128/MCB.23.6.1961-1967.2003.

RNA polymerase II accumulation in the promoter-proximal region of the dihydrofolate reductase and gamma-actin genes

Affiliations

RNA polymerase II accumulation in the promoter-proximal region of the dihydrofolate reductase and gamma-actin genes

Chonghui Cheng et al. Mol Cell Biol. 2003 Mar.

Abstract

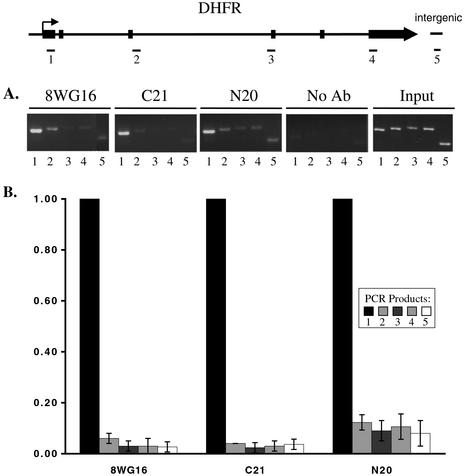
The carboxyl-terminal domain (CTD) of RNA polymerase II (Pol II) can be phosphorylated at serine 2 (Ser-2) and serine 5 (Ser-5) of the CTD heptad repeat YSPTSPS, and this phosphorylation is important in coupling transcription to RNA processing, including 5' capping, splicing, and polyadenylation. The mammalian endogenous dihydrofolate reductase and gamma-actin genes have been used to study the association of Pol II with different regions of transcribed genes (promoter-proximal compared to distal regions) and the phosphorylation status of its CTD. For both genes, Pol II is more concentrated in the promoter-proximal regions than in the interior regions. Moreover, different phosphorylation forms of Pol II are associated with distinct regions. Ser-5 phosphorylation of Pol II is concentrated near the promoter, while Ser-2 phosphorylation is observed throughout the gene. These results suggest that the accumulation of paused Pol II in promoter-proximal regions may be a common feature of gene regulation in mammalian cells.


Figures

FIG. 1.
FIG. 1.
Capping enzyme is concentrated at the promoter of the DHFR gene. HeLa cells containing high numbers of copies of the DHFR gene were cross-linked with formaldehyde. Following sonication, a specific antibody recognizing capping enzyme was added to the chromatin solution for immunoprecipitation of a DNA-capping enzyme complex. PCR was performed to analyze amounts of DNA along the gene that were associated with the capping enzyme. (A) Sonication efficiency of chromatin DNA. The sonicated chromatin solution was analyzed on an ethidium bromide-stained agarose gel after proteinase K treatment and reversal of the cross-links. Two samples are shown, with a 1-kb DNA ladder on the left of the gel. (B) Schematic diagram of the DHFR gene. Black boxes represent exons and thin lines represent introns. DNA fragments for PCR amplification (about 150 nucleotides [nt] long) are depicted as bars under the gene. A pair of primers amplifying an intergenic region downstream of the DHFR gene served as an internal background control. Sequences of primer pairs are presented in Materials and Methods. Numbers below each gel correspond to individual primer sets along the DHFR gene. (C) Chromatin IP with a capping enzyme antibody. PCRs with input DNA (before immunoprecipitation) were performed as controls for amplification efficiency of individual PCR primer sets. Chromatin IP without any antibody and with a nonspecific antibody (Oct2) served as negative controls. Agarose gel analyses of PCR products are shown, with lane numbers corresponding to regions of the gene.
FIG. 2.
FIG. 2.
Distribution of RNA Pol II along the DHFR gene. Chromatin IP was performed with antibodies against Pol II. C21 and N20 are antibodies against the C and N termini of the largest Pol II subunit and recognize both hyperphosphorylated and hypophosphorylated Pol II. 8WG16 is a Pol II antibody that preferentially recognizes the hypophosphorylated form of Pol II. Chromatin IP without specific antibody served as a negative control. (A) Agarose gel analyses of PCR products from chromatin IP. Lane numbers correspond to the region of the gene depicted at the top of the figure. (B) Real-time PCR results for quantification of Pol II association with the different regions of the DHFR gene. The numbers on the y axis represent the levels of Pol II association with different regions of the DHFR gene relative to that of the promoter region.
FIG. 3.
FIG. 3.
RNA Pol II density determined by nuclear run-on analysis of the DHFR gene. Nuclear run-on analysis was performed as described in Material and Methods. Newly synthesized, 32P-radiolabeled transcripts were hybridized to PCR products containing specific regions of the DHFR gene. The locations of PCR fragments are diagramed at the top and indicated on the left of the filters. PCR fragments 1 and 3 are genomic DNA, whereas 2 and 4 are cDNA encompassing parts of two adjacent exons. Radiolabeled DHFR RNA was transcribed with SP6 polymerase from each of the four fragments and then pooled and hybridized to the filter as a positive control for hybridization efficiencies among different DHFR probes. Analysis of labeled RNA from the nuclear run-on assay is shown on the right.
FIG. 4.
FIG. 4.
Different forms of phosphorylated RNA Pol II associate with different regions of the DHFR gene. Chromatin IP and real-time PCR were performed as for Fig. 2. Antibodies H5 and H14, which specifically recognize Ser-2 and Ser-5 phosphorylation of the CTD repeats, respectively, were used for chromatin IP. (A) Agarose gel analyses of PCR products from chromatin IP. Lane numbers correspond to regions of the gene depicted at the top. (B) Real-time PCR results for quantification of relative levels of phosphorylated Pol II associated with different regions of the DHFR gene.
FIG. 5.
FIG. 5.
TFIIH subunit p62 associates with the DHFR gene in the promoter-proximal region. Chromatin IP and PCR were performed as for Fig. 1. Antibody against TFIIH subunit p62 was used in chromatin IP assays. Agarose gel analyses of PCR products are shown; lane numbers correspond to regions of the gene.
FIG. 6.
FIG. 6.
Distribution of RNA Pol II on γ-actin gene. Schematic diagram of the γ-actin gene is shown at the top of the figure. Black boxes represent exons and thin lines represent introns. PCR products are depicted as bars under the gene. Amplification of an intergenic region served as an internal background control. (A) Specific antibodies used for chromatin IP are shown on top of each gel. Chromatin IP without any antibody or with a nonspecific antibody, Oct2, served as negative controls. PCR analyses of chromatin IP for different regions of the gene are shown. (B) Real-time PCR results are shown for quantification of DNA associated with specific proteins.

Similar articles

Cited by

References

    1. Agalioti, T., S. Lomvardas, B. Parekh, J. Yie, T. Maniatis, and D. Thanos. 2000. Ordered recruitment of chromatin modifying and general transcription factors to the IFN-beta promoter. Cell 103:667-678. - PubMed
    1. Andrulis, E. D., E. Guzman, P. Doring, J. Werner, and J. T. Lis. 2000. High-resolution localization of Drosophila Spt5 and Spt6 at heat shock genes in vivo: roles in promoter proximal pausing and transcription elongation. Genes Dev. 14:2635-2649. - PMC - PubMed
    1. Carey, M., and S. T. Smale. 1999. Protocol 3.1, nuclear run-on assay, p. 87. In M. Carey and S. T. Smale (ed.), Transcriptional regulation in eukaryotes. Cold Spring Harbor Laboratory Press, Cold Spring Harbor, N.Y.
    1. Cho, E. J., M. S. Kobor, M. Kim, J. Greenblatt, and S. Buratowski. 2001. Opposing effects of Ctk1 kinase and Fcp1 phosphatase at Ser 2 of the RNA polymerase II C-terminal domain. Genes Dev. 15:3319-3329. - PMC - PubMed
    1. Cho, E. J., T. Takagi, C. R. Moore, and S. Buratowski. 1997. mRNA capping enzyme is recruited to the transcription complex by phosphorylation of the RNA polymerase II carboxy-terminal domain. Genes Dev. 11:3319-3326. - PMC - PubMed

Publication types

LinkOut - more resources