. 2003 Mar;23(6):2068-82.
doi: 10.1128/MCB.23.6.2068-2082.2003.

The STE20 kinase HGK is broadly expressed in human tumor cells and can modulate cellular transformation, invasion, and adhesion

Affiliations

The STE20 kinase HGK is broadly expressed in human tumor cells and can modulate cellular transformation, invasion, and adhesion

Jocelyn H Wright et al. Mol Cell Biol. 2003 Mar.

Abstract

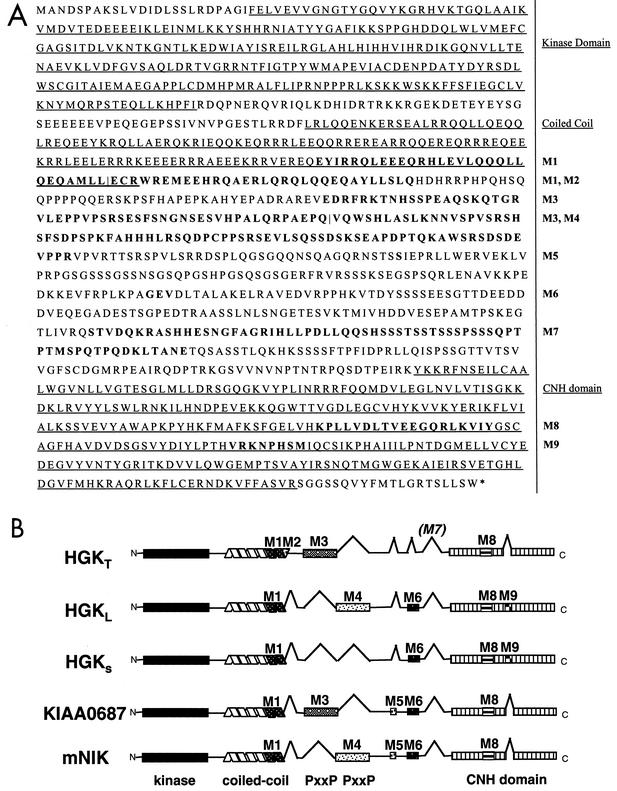
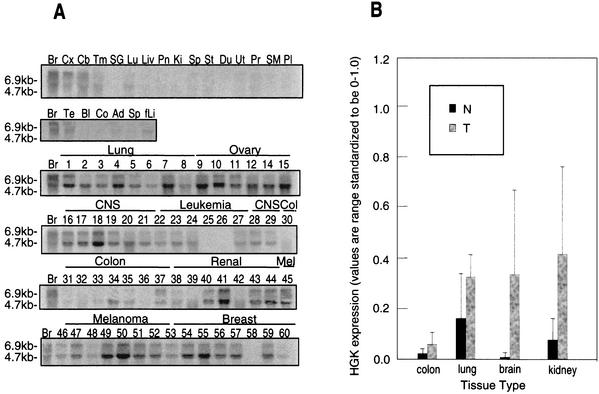
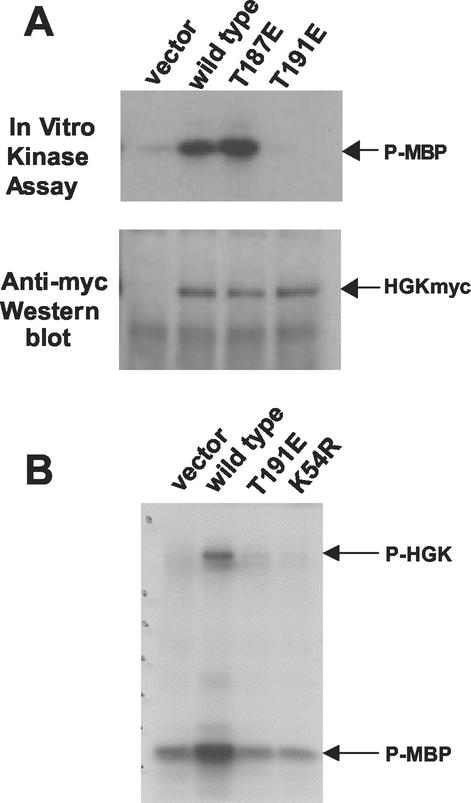
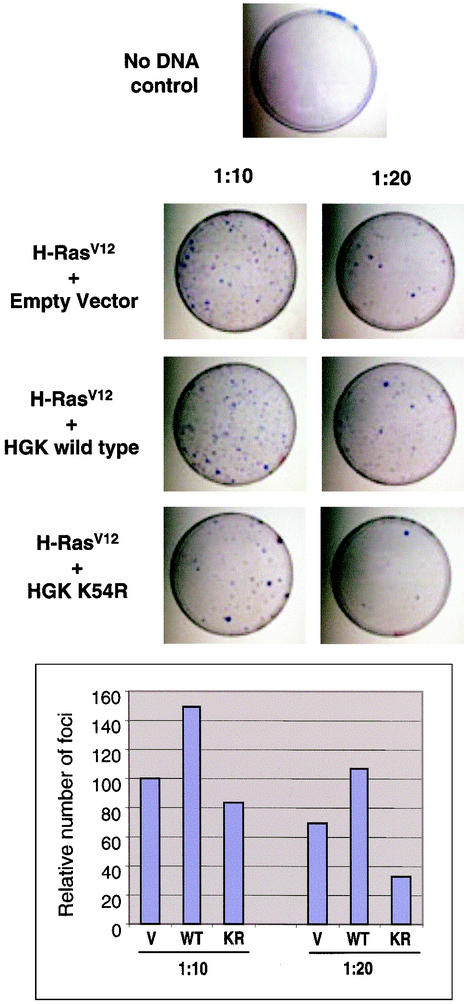
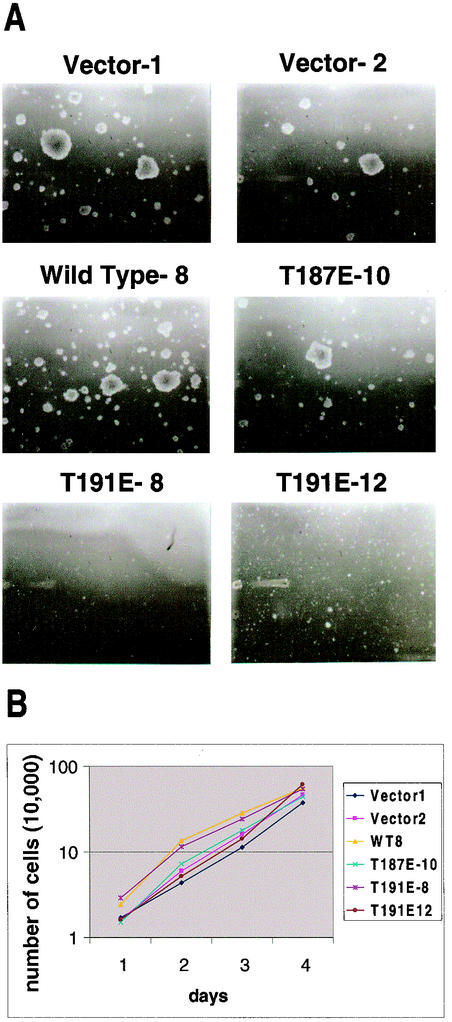
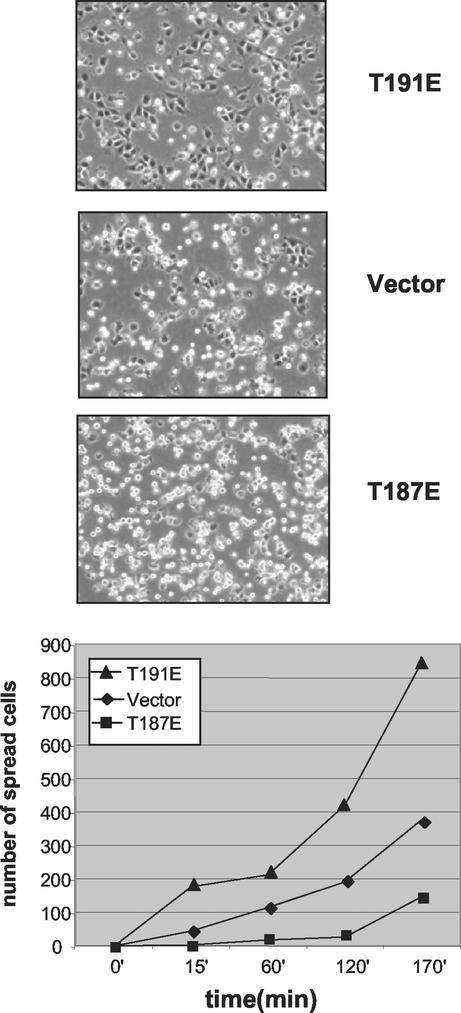
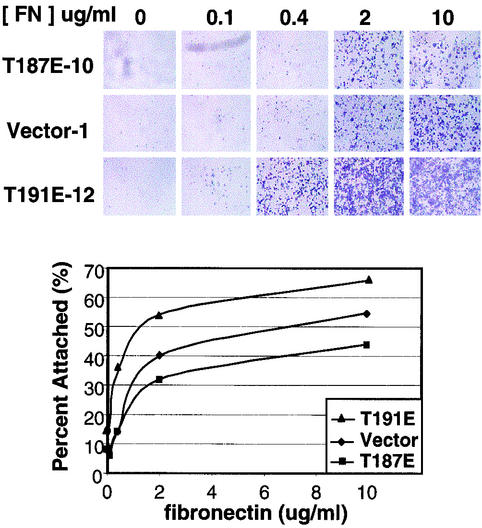
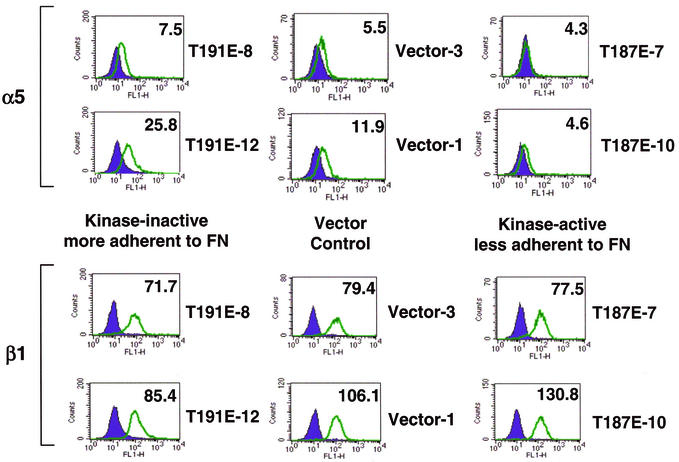
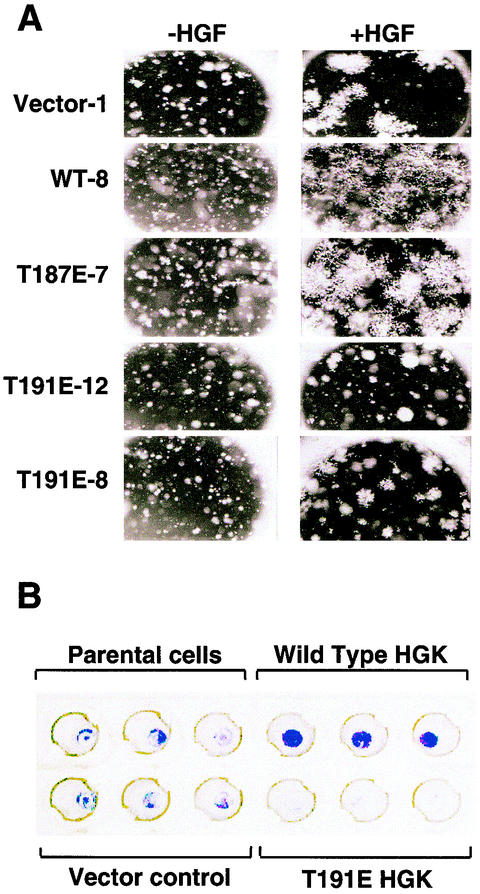
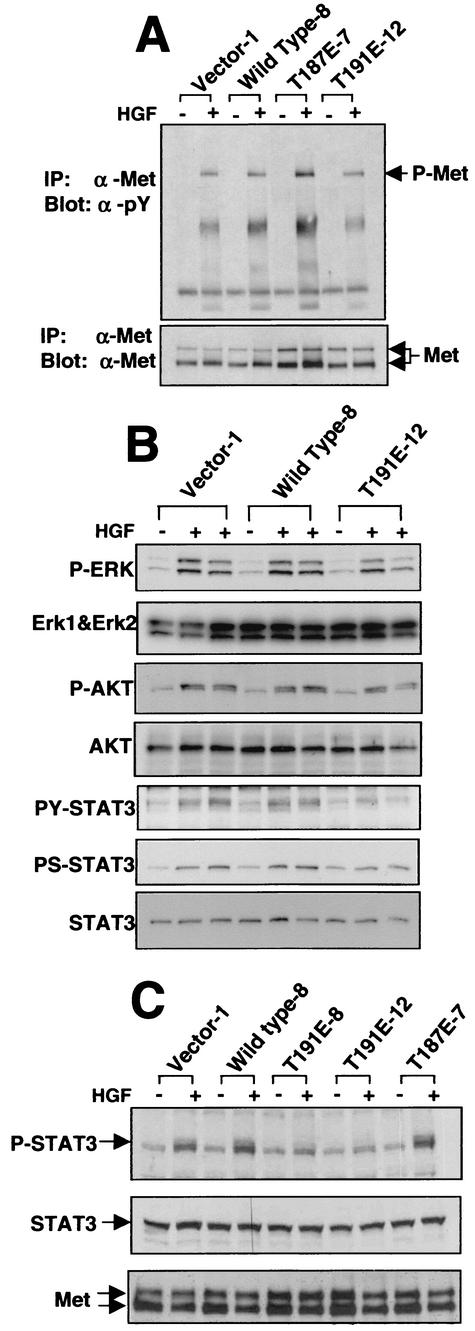
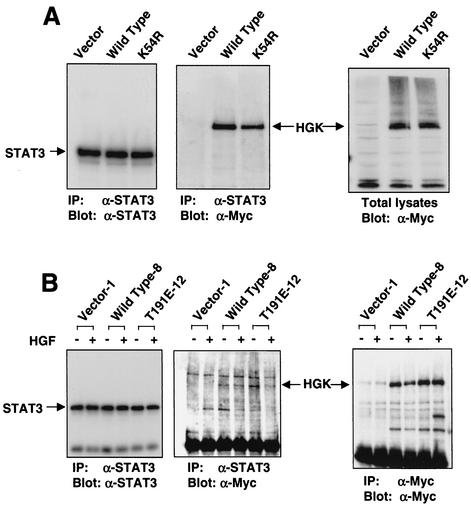
HGK (hepatocyte progenitor kinase-like/germinal center kinase-like kinase) is a member of the human STE20/mitogen-activated protein kinase kinase kinase kinase family of serine/threonine kinases and is the ortholog of mouse NIK (Nck-interacting kinase). We have cloned a novel splice variant of HGK from a human tumor line and have further identified a complex family of HGK splice variants. We showed HGK to be highly expressed in most tumor cell lines relative to normal tissue. An active role for this kinase in transformation was suggested by an inhibition of H-Ras(V12)-induced focus formation by expression of inactive, dominant-negative mutants of HGK in both fibroblast and epithelial cell lines. Expression of an inactive mutant of HGK also inhibited the anchorage-independent growth of cells yet had no effect on proliferation in monolayer culture. Expression of HGK mutants modulated integrin receptor expression and had a striking effect on hepatocyte growth factor-stimulated epithelial cell invasion. Together, these results suggest an important role for HGK in cell transformation and invasiveness.


Figures

FIG. 1.
FIG. 1.
(A) HGK amino acid sequence: predicted maximal HGK protein containing all possible alternatively spliced modules. The kinase domain, the coiled-coil domain, and the CNH domain are underlined. Alternatively spliced modules M1 to M9 are shown in bold and labeled to the right of the sequence. For adjacent modules M1/M2 and M3/M4, a vertical line defines their boundaries. (B) Schematic illustration of the domain structure of known HGK splice variants compared with mouse NIK. Alternatively spliced modules are indicated with inverted V's when absent and alternative patterning where present. The HGK gene product that we cloned from a tumor cell line (HGKT) contains alternative modules M1, M2, M3, and M8. The two HGK cDNAs from a human macrophage library contain M1, M6, M8, and M9 (HGKS; short version) and M1, M4, M6, M8, and M9 (HGKL; long version). KIAA0687 isolated from brain has modules M1, M3, M5, M6, and M8. The mouse NIK clone contains M1, M4, M5, M6, and M8.
FIG. 2.
FIG. 2.
(A) HGK mRNA is overexpressed in human tumor cell lines. Total RNA was purified from various human tissues (top two rows) as well as from human tumor cell lines from the standard tumor panel from the National Cancer Institute. Abbreviations for normal tissues: (first row) Br, brain; Cx, cortex; Cb, cerebellum; Tm, thymus; SG, salivary gland; Lu, lung; Liv, liver; Pn, pancreas; Ki, kidney; Sp, spleen; St, stomach; Du, duodenum; Ut, uterus; Pr, prostate; SM, skeletal muscle; Pl, placenta; (second row) Br, brain; Te, testis; Bl, bladder; Co, colon; Ad, adipose tissue; fLi, fetal liver. Numbering for the NCI tumor panel: 1, HOP-92; 2, EKVXl 3, NCI-H23; 4, NCI-H226; 5, NCI-H322; 6, NCI-H460; 7, NCI-H522; 8, A549; 9, HOP-62; 10, OVCAR-3; 11, OVCAR-4; 12, OVCAR-5; 14, IGROV1; 15, SK-OV-3; 16, SNB-19; 17, SNB-75; 18, U251; 19, SF-288; 20, SF-295; 21, SF-539; 22, CCRF-CEM; 23, K-562; 24, MOLT-4; 25, HL-60; 26, RPMI-8226; 27, SR; 28, DU-145; 29, PC-3; 30, HT-29; 31, HCC-2998l; 32, HCT116; 33, SW620; 34, COLO-205; 35, HCT-15; 36, M-12; 37, UO-31; 38, SN12C; 39, A498; 40, Caki-1; 41, RXF-393; 42, ACHN; 43, 786-0; 44, TK-10; 45, LOXIMVI; 46, Malme-3 M; 47, SK-MEL-2; 48, SK-MEL-5; 49, SK-MEL-28; 50, UACC-62; 51, UACC-257; 52, M14; 53, MCF-7; 54, MCF-7/ADR; 55, Hs578T; 56, MDA-MB-231; 57, MDA-MB-431; 58, MDA-N; 59, BT-549, and 60, T-47D. (B) Quantification of HGK in tumor versus normal cells from selected individual tissues. The bar graph shows the relative signal from PhosphorImager quantification of dot blot arrays from tumor cell lines and normal tissues. From left to right: colon tumor-normal, 2.7-fold, P = 0.210; lung tumor-normal, 2.0, P = 0.034; brain tumor-normal, 46.3, P = 0.007; kidney tumor-normal, 5.5, P = 0.076. P values were calculated with the Mann-Whitney test.
FIG. 3.
FIG. 3.
Kinase activity of HGK mutants in RIE-1 cells. HGK wild-type and mutant proteins were immunoprecipitated from stable pools of RIE-1 cells infected with HGK retroviruses. (A) Comparison of the T187E and T191E activation loop mutations with wild-type kinase. The top panel shows an autoradiogram of samples analyzed by SDS-PAGE, showing the relative amount of 32P incorporated into myelin basic protein (MBP) after incubation of the immunoprecipitate and [γ-32P]ATP for 20 min at 30οC. The bottom panel shows the relative amount of HGK proteins in the immunoprecipitate. (B) Comparison of the T191E and K54R catalytically inactive HGK mutants with wild-type HGK. An autoradiogram shows the relative amount of 32P incorporation both into HGK protein (autophosphorylation) and into added MBP in the immunoprecipitate.
FIG. 4.
FIG. 4.
Dominant negative mutant HGK can suppress Ras-induced focus formation in NIH 3T3 cells. (Top) Images of tissue culture plates stained with crystal violet to visualize the foci are shown from a representative experiment with NIH 3T3 cells. The relative number of foci per plate generated by H-RasV12 in the presence of a 10- or 20-fold molar excess of plasmid encoding HGK wild-type, HGK K54R inactive mutant kinase, or vector control is shown. The panel on the top shows background levels of foci generated by transfection of a vector control (no H-RasV12). (Bottom) The bar graph shows the relative number of foci per plate (setting the number of foci in the Ras/vector control 1:10 at 100%). The data represent an average of two experiments.
FIG. 5.
FIG. 5.
HGK expression levels in stable clones of RIE-1 cells. (A)Western blot of SDS-6% PAGE on which HGK-Myc protein immunoprecipitated with anti-Myc antiserum was separated is shown. Vector clones contain an empty pLXSN virus. Active clones contain the T187E HGK mutant virus, and inactive clones contain the T191E HGK virus.
FIG. 6.
FIG. 6.
HGK kinase activity is required for growth of RIE-1 cells in soft agar but not growth in monolayer. (A) Shown are photomicrographs (10× magnification) of colonies formed in soft agar from RIE-1 stable clones after 28 days of growth. (B) Shown is a semilogarithmic plot of growth curves generated for the same six RIE clones shown in A over a 4-day period, with duplicate wells counted every 24 h.
FIG. 7.
FIG. 7.
Role for HGK in cell spreading. RIE-1 stable clones expressing active and inactive alleles of HGK as well as vector controls were detached with trypsin and plated on fibronectin. Photomicrographs (10× magnification) were taken at various time points thereafter. The graph shows the relative number of spread (phase-dark) cells counted in three separate fields for each clone as a function of time. Representative photographs from the 170-min time point are shown on top.
FIG. 8.
FIG. 8.
HGK kinase activity interferes with cell attachment. RIE-1 stable clones expressing active and inactive alleles of HGK as well as vector controls were detached with trypsin and plated on various concentrations of fibronectin (FN). After 60 min, unattached cells were washed away, and the remaining cells were stained with crystal violet. (A) Photomicrographs (2× magnification) show the presence of remaining cells at different concentrations of fibronectin. (B) By comparison with a standard curve of cells plated on polylysine, the relative amount of cells was quantified by measuring the amount of solubilized dye by optical density. The graph shows the relative optical density at 550 nm as a function of fibronectin concentration for the different RIE-1 clones.
FIG. 9.
FIG. 9.
HGK mutant expression affects cell surface α5 integrin subunit levels. By fluorescence-activated cell sorting analysis, the level of cell surface integrin receptors was compared for different RIE-1 stable clones. Histograms show the relative fluorescence intensity of cells stained with fluorescein isothiocyanate-labeled integrin receptor antibodies. The level of specific integrin receptor (α5 subunit on top and β1 subunit on the bottom) are shown as open green peaks. Isotype controls are shown as solid purple peaks. The relative shift of the green peak to the right relative to the isotype control indicates the level of that particular receptor. Numbers in the upper right corner of each histogram are the mean fluorescence intensity (normalized to the relevant isotype control).
FIG. 10.
FIG. 10.
(A) Role for HGK in RIE cell morphogenesis. HGK kinase expression affects RIE-1 cells in a tubulogenesis assay. Shown are photomicrographs (3.2× magnification) of colonies formed in Matrigel after 6 days of growth. Each clone is shown with and without added HGF. Vector control is an RIE-1 clone with pLXSN alone. WT-8 is a clone expressing wild-type HGK. T187E-7 is a clone expressing the active HGK mutant; T191E-12 and T191E-8 are two clones expressing the inactive HGK mutant. (B) Role for HGK in RIE cell invasion. Boyden chambers in which the cells of the lower membrane are fixed and stained with crystal violet are shown. The amount of staining is proportional to the number of cells that successfully invaded through the Matrigel plug to colonize the lower membrane after stimulation with 50 ng of human HGF per ml for 4 days. Triplicate wells are shown from an experiment with RIE-1 stable pools expressing vector alone, wild-type, or inactive (T191E) HGK.
FIG. 11.
FIG. 11.
HGK mutant expression affects HGF-induced STAT3 phosphorylation. Western blots of cell lysates prepared from starved RIE-1 cells with and without stimulation with 100 ng of HGF per ml are shown. (A) Western blots of anti-Met receptor immunoprecipitates (IP) probed with antiphosphotyrosine (α-pY) antibody in the top panel and anti-Met receptor antibody in the bottom panel are shown. (B) A panel of Western blots prepared from total cell lysates stimulated for 0, 30, and 60 min with HGF are shown. From top to bottom: anti-phospho-mitogen-activated protein kinase, anti-ERK1 plus anti-ERK2, anti-phospho-AKT, anti-AKT anti-phospho-STAT3 (Y705), anti-phospho-STAT3 (S727), and anti-STAT3. (C) Total cell lysates from unstimulated cells and cells 30 min after HGF stimulation. The top panel was probed with an anti-phospho-Y705 STAT3-specific antibody; the middle panel was probed with an anti-STAT3 antibody; the bottom panel shows anti-Met receptor immunoprecipitations from the same lysates, probed with an anti-Met antibody. Data from RIE-1 clones expressing empty vector (vector), wild-type HGK, T187E HGK (active mutant), and T191E HGK (inactive mutant) are shown.
FIG. 12.
FIG. 12.
HGK kinase coimmunoprecipitated with STAT3. (A) 293T cells were transfected with Myc-tagged wild-type K54R (inactive) HGK and the vector control. Lysates were immunoprecipitated with anti-STAT3, followed by analysis on Western blots probed with anti-STAT3 (left) and anti-Myc (middle). Total lysates were analyzed with anti-Myc in parallel. (B) RIE-1 clones expressing wild-type and kinase-inactive (T191E-12) HGK were stimulated with HGF for 0 or 30 min Lysates were immunoprecipitated with both anti-Myc and anti-STAT3. The middle panel shows the STAT3 immunoprecipitate probed with anti-Myc. The left panel shows the same immunoprecipitate probed with anti-STAT3, and the right panel is an anti-Myc immunoprecipitate probed with anti-Myc for HGK. The HGK and STAT3 protein bands are indicated with arrows.

References

    1. Bagrodia, S., and R. A. Cerione. 1999. Pak to the future. Trends Cell Biol. 9:350-355. - PubMed
    1. Bao, Q., and R. C. Hughes. 1995. Galectin-3 expression and effects on cyst enlargement and tubulogenesis in kidney epithelial MDCK cells cultured in three-dimensional matrices in vitro. J. Cell Sci. 108:2791-2800. - PubMed
    1. Becker, E., U. Huynh-Do, S. Holland, T. Pawson, T. O. Daniel, and E. Y. Skolnik. 2000. Nck-interacting Ste20 kinase couples Eph receptors to c-Jun N-terminal kinase and integrin activation. Mol. Cell. Biol. 20:1537-1545. - PMC - PubMed
    1. Berman, A. E., and N. I. Kozlova. 2000. Integrins: structure and functions. Membrane Cell Biol. 13:207-244. - PubMed
    1. Bischoff, J. R., L. Anderson, Y. Zhu, K. Mossie, L. Ng, B. Souza, B. Schryver, P. Flanagan, F. Clairvoyant, C. Ginther, C. S. Chan, M. Novotny, D. J. Slamon, and G. D. Plowman. 1998. A homologue of Drosophila aurora kinase is oncogenic and amplified in human colorectal cancers. EMBO J. 17:3052-3065. - PMC - PubMed

Publication types

MeSH terms

Associated data