. 2003 Mar 18;100(6):3197-202.
doi: 10.1073/pnas.2628068100. Epub 2003 Feb 28.

Watching proteins fold one molecule at a time

Affiliations

Watching proteins fold one molecule at a time

Elizabeth Rhoades et al. Proc Natl Acad Sci U S A. .

Erratum in

  • Proc Natl Acad Sci U S A. 2003 Jun 10;100(12):7418

Abstract

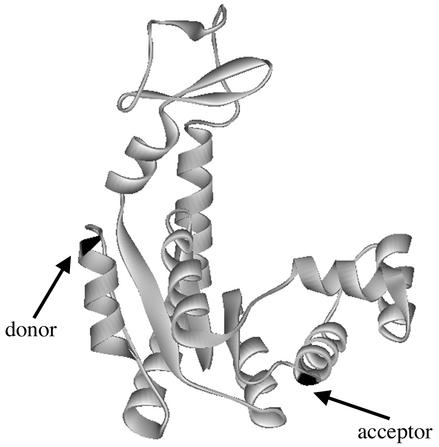
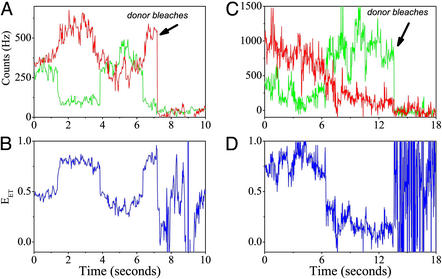
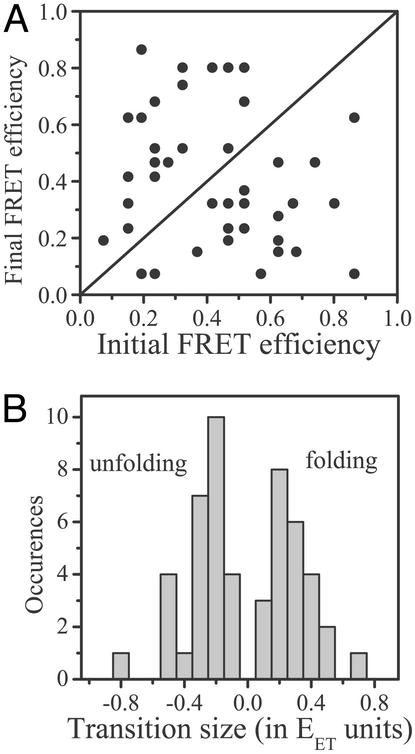
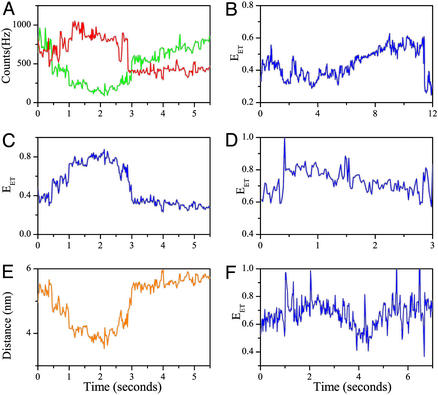
Recent theoretical work suggests that protein folding involves an ensemble of pathways on a rugged energy landscape. We provide direct evidence for heterogeneous folding pathways from single-molecule studies, facilitated by a recently developed immobilization technique. Individual fluorophore-labeled molecules of the protein adenylate kinase were trapped within surface-tethered lipid vesicles, thereby allowing spatial restriction without inducing any spurious interactions with the environment, which often occur when using direct surface-linking techniques. The conformational fluctuations of these protein molecules, prepared at the thermodynamic midtransition point, were studied by using fluorescence resonance energy transfer between two specifically attached labels. Folding and unfolding transitions appeared in experimental time traces as correlated steps in donor and acceptor fluorescence intensity. The size of the steps, in fluorescence resonance energy transfer efficiency units, shows a very broad distribution. This distribution peaks at a relatively low value, indicating a preference for small-step motion on the energy landscape. The time scale of the transitions is also distributed, and although many transitions are too fast to be time-resolved here, the slowest ones may take >1 sec to complete. These extremely slow changes during the folding of single molecules highlight the possible importance of correlated, non-Markovian conformational dynamics.


Figures

Figure 1
Figure 1
Ribbon representation of the structure of AK from E. coli (22). Positions 73 and 203 (labeled by acceptor and donor fluorophores, respectively) are marked with arrows.
Figure 2
Figure 2
(A and B) Distributions of average fluorescence polarization values of single AK molecules labeled with the donor only obtained after excitation with circularly polarized light. The distribution shown in A is for molecules trapped in vesicles at 0.4 M Gdn⋅HCl, and the one shown in B is for molecules adsorbed directly on glass. The very narrow width of the polarization distributions of vesicle-trapped molecules, compared with the width of the distribution of glass-adsorbed molecules, indicates freedom of rotation of the trapped molecules, as discussed in detail by Boukobza et al. (17). A similar experiment performed with acceptor-labeled AK molecules and showing analogous results was presented in that article. The polarization distribution of molecules trapped in vesicles under native conditions (data not shown) is indistinguishable from the one shown in A. (C) A typical time-dependent fluorescence polarization trajectory of a single AK molecule labeled with the donor only and trapped in a lipid vesicle. The vertically polarized (IV) and horizontally polarized (IH) components of the fluorescence are shown in gray and black, respectively. (D) The fluorescence polarization calculated from the data in C. The lack of any long-term jumps in the polarization indicates that this protein molecule does not become static (e.g., due to adsorption on the vesicle wall) for any considerable amount of time. Very similar time traces were obtained from many individual molecules.
Figure 3
Figure 3
(A and B) Distributions of EET values obtained from single-molecule trajectories of labeled AK molecules trapped in vesicles under native and denaturing (2 M Gdn⋅HCl) conditions, respectively. The distributions are essentially unimodal, and their average values, 0.8 and 0.14, are close to the ensemble values. (C) Distribution of EET values obtained from single-molecule trajectories of encapsulated AK molecules prepared in 0.4 M Gdn⋅HCl (near midtransition conditions) that showed folding/unfolding transitions. The distribution can be roughly divided into two subdistributions, one due to the “denatured” ensemble, with EET values <≈0.45, and one due to the “folded” ensemble, with EET values larger than that value, as illustrated by the black lines, which are Gaussian fits. The distribution of FRET efficiencies of all the trajectories measured for molecules in 0.4 M Gdn⋅HCl (data not shown) has peaks at the same values as the distribution made from molecules that only showed transitions (C), with a greater proportion of the distribution in the folded ensemble. Additionally, the average value of this single-molecule distribution (0.6) matches quite well with the measured ensemble value. All distributions were obtained from trajectories first smoothed with the nonlinear filter described in the Fig. 4 legend.
Figure 4
Figure 4
(A and C) Time traces of individual vesicle-trapped AK molecules under midtransition conditions with the acceptor signal in red and the donor in green. The traces were collected with 20-msec time bins. They then were smoothed by using the forward–backward nonlinear filter developed by Chung and Kennedy (31) for ion-channel current analysis. In this filter, predictors derived from the data are adaptively weighted to ensure that fast intensity jumps will not be smeared, as happens when standard rolling-average procedures are used. The nonlinear filter as used here reduces the noise in the trajectories by a factor of ≈4 while correctly preserving intensity transitions. (B and D) EET trajectories calculated from the signals in A and C, respectively. In A and B several transitions occur between states that are essentially within the “folded” ensemble, whereas in C and D a single transition takes the molecule from the folded to the “denatured” ensemble. Note that transitions can be strictly recognized by an anticorrelated change in the donor and acceptor fluorescence intensities as opposed to uncorrelated fluctuations sometimes appearing in one of the signals.
Figure 5
Figure 5
(A) Map of folding/unfolding transitions obtained from single-molecule trajectories. Each point represents the final vs. initial FRET efficiency for one transition. The line is drawn to distinguish folding and unfolding transitions; above the line are folding transitions (efficiency increases), and below the line are unfolding transitions (efficiency decreases). (B) Distribution of transition sizes (i.e., final minus initial efficiencies) as obtained from the map in A. The two branches of the distribution represent unfolding and folding transitions, respectively. The overall similarity of the shape of the two branches indicates uniform sampling of the energy landscape. They both peak at a low efficiency value, signifying a preference for small-step transitions.
Figure 6
Figure 6
Time-dependent signals from single molecules showing slow folding or unfolding transitions. (A) Signals showing a slow folding transition starting at ≈0.5 sec and ending at ≈2 sec. The same signals display a fast unfolding transition as well (at ≈3 sec). The acceptor signal is shown in red, and the donor is shown in green. (B) EET trajectory calculated from the signals in A. (C) The interprobe distance trajectory showing that the slow transition involves a chain compaction by only 20%. The distance was computed from the curve in B (32) by using a Förster distance (R0) of 49 Å. This Förster distance was calculated by assuming an orientational factor (κ2) of 2/3. However, the point discussed here (and in the text) does not depend on the exact value of κ2 or R0. (DF) Additional EET trajectories demonstrating slow transitions. These transitions were identified, as already noted, by anticorrelated donor–acceptor intensity changes.

Similar articles

Cited by

References

    1. Anfinsen C, Haber E, Sela M, White F H. Proc Natl Acad Sci USA. 1961;47:1309–1314. - PMC - PubMed
    1. Dill K A, Chan H S. Nat Struct Biol. 1997;4:10–19. - PubMed
    1. Onuchic J N, Luthey-Schulten Z, Wolynes P G. Annu Rev Phys Chem. 1997;48:545–600. - PubMed
    1. Thirumalai D, Klimov D K. Curr Opin Struct Biol. 1999;9:197–207. - PubMed
    1. Shea J-E, Brooks C L. Annu Rev Phys Chem. 2001;52:499–535. - PubMed

Publication types