. 2003 Mar 3;197(5):585-99.
doi: 10.1084/jem.20021859.

Compartmentalized production of CCL17 in vivo: strong inducibility in peripheral dendritic cells contrasts selective absence from the spleen

Affiliations

Compartmentalized production of CCL17 in vivo: strong inducibility in peripheral dendritic cells contrasts selective absence from the spleen

Judith Alferink et al. J Exp Med. .

Abstract

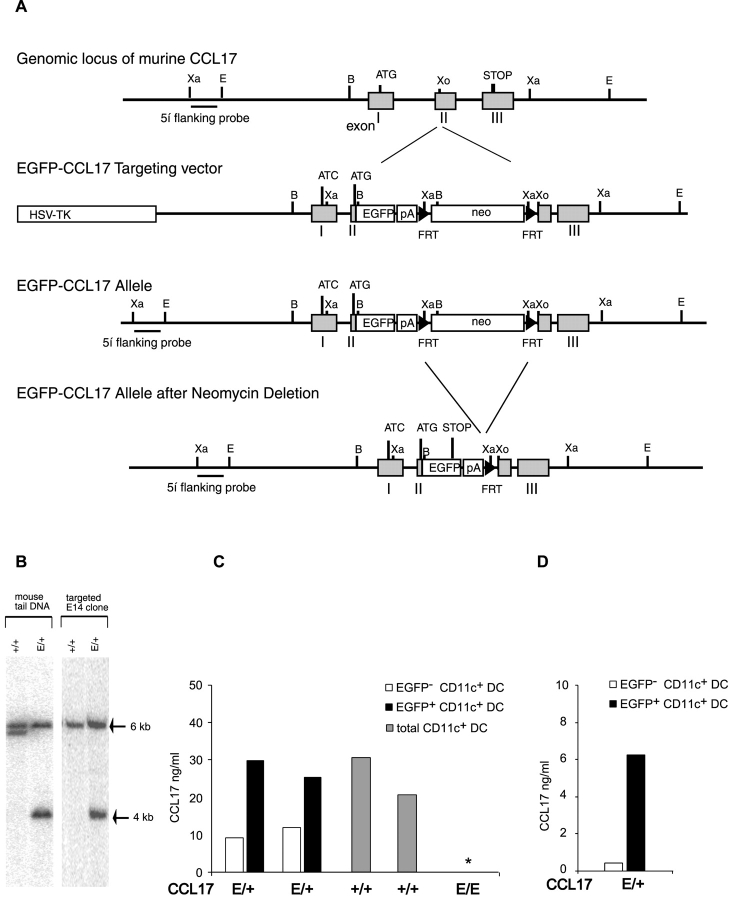
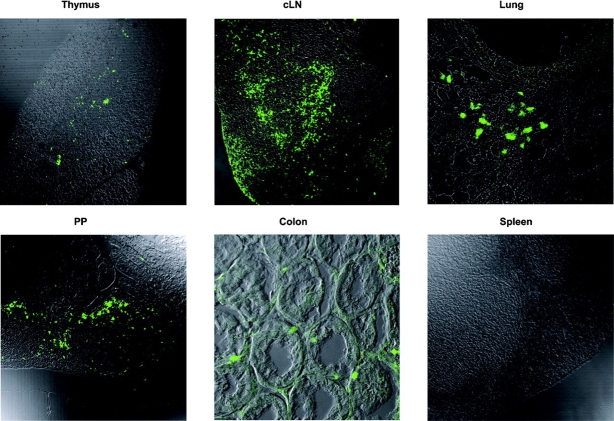
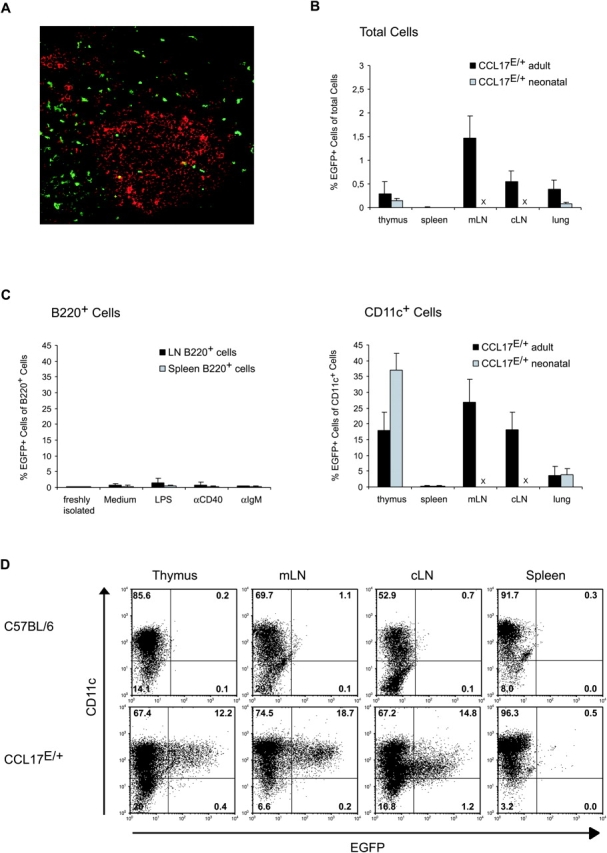
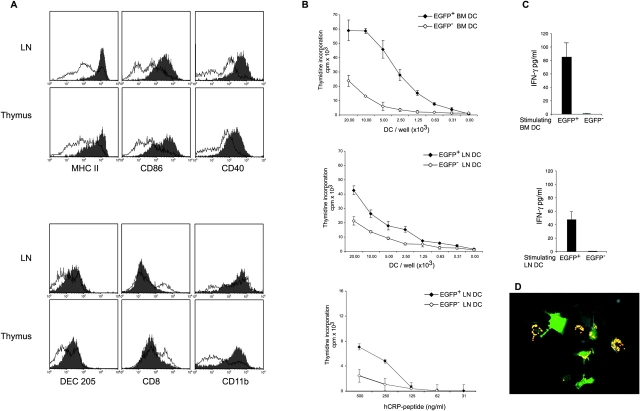
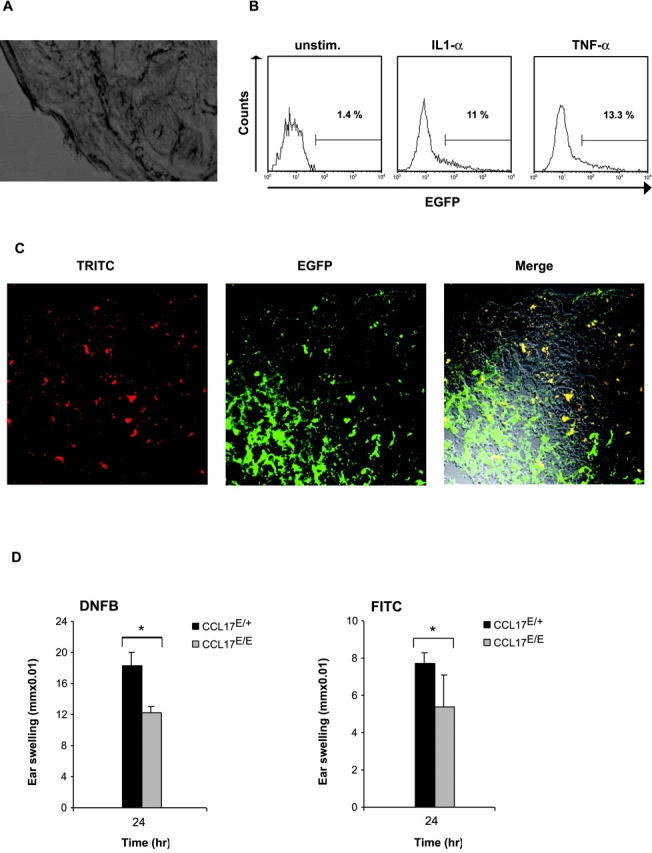
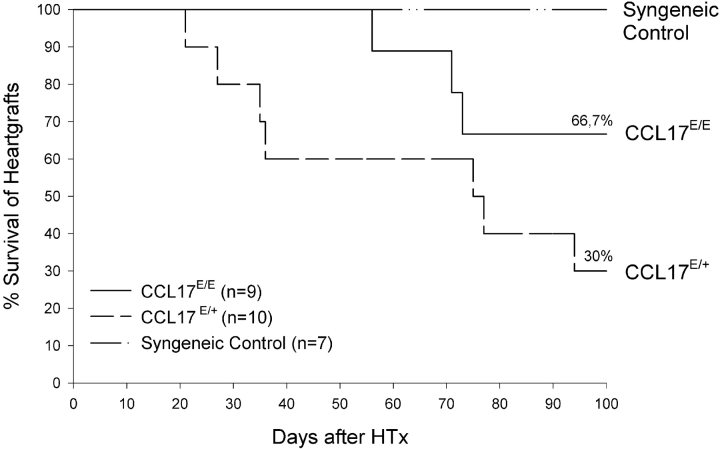
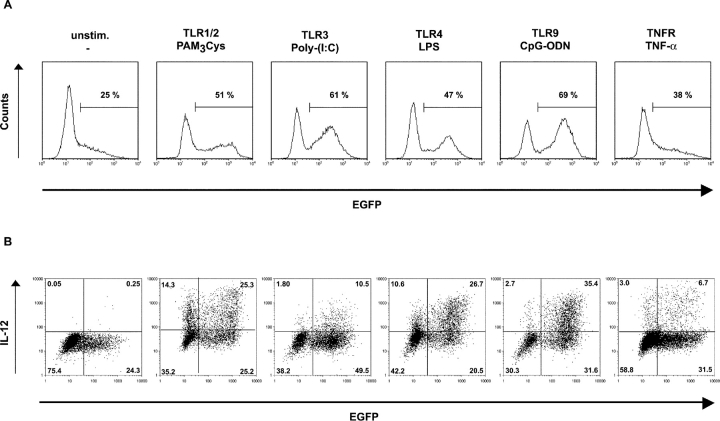
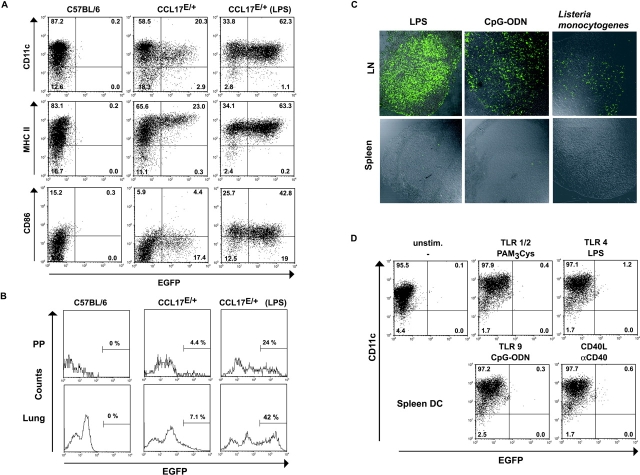
Dendritic cells (DCs)(*) fulfill an important regulatory function at the interface of the innate and adaptive immune system. The thymus and activation-regulated chemokine (TARC/CCL17) is produced by DCs and facilitates the attraction of activated T cells. Using a fluorescence-based in vivo reporter system, we show that CCL17 expression in mice is found in activated Langerhans cells and mature DCs located in various lymphoid and nonlymphoid organs, and is up-regulated after stimulation with Toll-like receptor ligands. DCs expressing CCL17 belong to the CD11b(+)CD8(-)Dec205(+) DC subset, including the myeloid-related DCs located in the subepithelial dome of Peyer's patches. CCL17-deficient mice mount diminished T cell-dependent contact hypersensitivity responses and display a deficiency in rejection of allogeneic organ transplants. In contrast to lymphoid organs located at external barriers of the skin and mucosa, CCL17 is not expressed in the spleen, even after systemic microbial challenge or after in vitro stimulation. These findings indicate that CCL17 production is a hallmark of local DC stimulation in peripheral organs but is absent from the spleen as a filter of blood-borne antigens.


Figures

Figure 1.
Figure 1.
Generation of CCL17 reporter and CCL17-deficient mice. (A) Targeting strategy for insertion of the EGFP cDNA into the murine CCL17 locus. The murine genomic CCL17 locus with partial restriction map (top), the targeting construct (middle), and the targeted allele before and after neomycin deletion (bottom) are shown. The 3 exons of the CCL17 gene are indicated as gray boxes and the hybridization probe used for Southern blot analysis as a black bar. The EGFP reporter gene and the neomycin resistance cassette are indicated as open boxes, FRT-sites as black arrows. Restriction sites: B, BamHI; Xa, XbaI; Xo, XhoI. (B) Representative Southern blot analysis of XbaI digested genomic DNA from targeted ES cell clone and mouse tail biopsies from WT (CCL17+/+) and heterozygous CCL17 mutant (CCL17E/+) littermates. The WT and targeted allele give signals at 6 and 4 kb, respectively, after hybridization with the 5′ flanking probe. (C) CCL17 production by BM-derived DCs from CCL17E/+, CCL17+/+, and homozygous CCL17-deficient (CCL17E/E) mice. BM-derived DCs from CCL17E/+ and CCL17E/E mice were sorted into EGFP+CD11c+ (black bars) and EGFP CD11c+ DCs (white bars) and those from CCL17+/+ mice as CD11c+ cells. All cells were cultured in vitro for 15 h. CCL17 production was measured by ELISA. * CCL17 protein was not detected in the supernatants of BM-derived DCs from CCL17E/E mice. Shown are data from two independent sorts from each group. (D) CCL17 production by sorted EGFP+CD11c+ (black bars) and EGFP-CD11c+ DC (white bars) from CCL17E/+ mice. BM-derived DCs from CCL17E/+ mice were stimulated with LPS for 15 h in vitro before cell sorting. Sorted EGFP+CD11c+ (black bars) and sorted EGFP-CD11c+ DCs (white bars) were cultured in vitro for 15 h. CCL17 production was measured by ELISA.
Figure 2.
Figure 2.
Localization of green fluorescent cells in CCL17E/+ mice. Organs were isolated from CCL17E/+ mice, fixed with 4% PFA followed by incubation in 20% sucrose and cryostat sections were analyzed by confocal microscopy. Paraffin sections were used for analysis of the colon.
Figure 3.
Figure 3.
CCL17 is expressed by a subpopulation of DCs. (A) Paraffin sections of cLNs from CCL17E/+ mice were stained with anti-CD45R Abs and a biotinylated goat anti rat secondary antibody followed by Streptavidin PE (red) for detection of B220+ cells. (B) Frequency of CCL17+ cells among total cells and among MACS-enriched CD11c+ cells (C, right) from collagenase-digested organs of adult (black bars) or neonatal (gray bars) reporter mice. B cells were sorted as B220+ cells from spleen or LNs of adult CCL17E/+ mice and stimulated with the indicated substances for 48 h (C, left). × LNs were not investigated in neonatal reporter mice. (D) MACS enriched DCs isolated from collagenase digested thymus, mesenteric LN (mLN), cutaneous LN (cLN), and spleen from control C57BL/6 and CCL17E/+ mice were stained for CD11c and analyzed by flow cytometry. The percentages of cells are indicated within each quadrant.
Figure 4.
Figure 4.
CCL17+ DCs exhibit a myeloid-related phenotype and possess enhanced stimulatory but diminished phagocytotic capacity. (A) Cytofluorimetric analysis of DCs isolated by MACS from collagenase digested cLNs and thymus of CCL17E/+ mice. The histograms show expression of surface MHC class II (I-Ab), CD86, and CD40 (top histograms) and lineage-related markers DEC205, CD8, and CD11b (bottom histograms) on gated CCL17+ DCs (shaded histograms) and CCL17 DCs (solid lines). The figure shows one of four representative experiments with similar results. (B) DCs were generated from the BM (top) or isolated from LNs (middle and bottom) of CCL17E/+ mice and sorted into CCL17+ DCs (filled diamonds) and CCL17 DCs (open diamonds). DC subpopulations were pulsed with 1 μg/ml CRP peptide (89–101) and cultured with 2 × 10⁴ MACS purified CD4+ T cells from Dep TCR transgenic mice (top and middle). 5 × 10³ DCs were pulsed with titrated amounts of CRP peptide (89–101) and incubated with purified CD4+ T cells from Dep TCR transgenic mice (bottom). T cell proliferation was determined by (3H)-thymidine incorporation during the final 17 h of a 72 h culture. Data represent the means ± SD of triplicate determinations from one of two similar experiments. (C) IFN-γ production by CD4+ Dep transgenic T cells after stimulation with CCL17+ DCs (black bars) or CCL17 DCs (white bars). Supernatants were collected from the cultures described in (B) 72 h after stimulation with BM DCs or LN DCs, respectively, and IFN-γ secretion was assessed by ELISA. Data are the means plus SD of duplicate determinations. Shown is one of two similar experiments. (D) Diminished phagocytosis of BM-derived CCL17+ DCs compared with CCL17 DCs. Purified BM-derived DCs from CCL17E/+ mice were incubated for 2 h with fluorescent microspheres before fixation with 4% PFA on coverslides. A representative field of cells analyzed by confocal microscopy is shown.
Figure 5.
Figure 5.
Expression of CCL17 in epidermal LCs upon maturation and impairment of contact hypersensitivity responses in the absence of CCL17. (A) Absence of CCL17-expression in the skin of CCL17E/+ mice. Cryostat sections of tail skin of reporter mice fixed with 4% PFA were analyzed by confocal analysis. (B) Cell suspensions were prepared by trypsinization of epidermal ear sheets of reporter mice and the phenotype of LCs was determined by flow cytometry. LCs were gated based on expression of MHC class II I-Ab and analyzed for CCL17/EGFP expression before or 15 h after culture in cytokine-supplemented medium (GMCSF + IL-1α [10 ng/ml] or GMCSF + TNF-α [10 ng/ml]). (C) Up-regulation of CCL17 by epidermal LCs after contact sensitization and migration to the draining LN. Mice were painted with TRITC dissolved in butylphtalate and acetone (1:1) 24 h before cryostat sections of draining LNs were analyzed by confocal microscopy. Skin-derived LCs in the LN can be identified by TRITC uptake and appear as red-fluorescent cells (first from left). CCL17-expression (green) and merged confocal analysis of green and red fluorescence are shown (second and third from left). TRITC+ cells coexpressing CCL17 can be identified by yellow fluorescence. (D) CCL17-deficient mice display reduced contact hypersensitivity responses to DNFB and FITC. CHS was induced in CCL17-deficient (CCL17E/E) and CCL17E/+ control mice by sensitization with 0.4% DNFB or 0.5% FITC on day 0 and day 1. On day 4, sensitized mice were ear challenged with 0.4% DNFB or 0.5% FITC. Ear thickness was measured before and 24 h after challenge. Data represent mean swelling values ± SD obtained with 11 (DNFB) and 10 (FITC) mice in two independent experiments. The differences between mean values derived from CCL17E/E and CCL17E/+ are statistically significant (P < 0.01).
Figure 6.
Figure 6.
Enhanced survival of cardiac allografts in the absence of CCL17. Heterotopic mouse heart transplantation using BALB/c donor hearts and either CCL17E/E, CCL17E/+, or BALB/c mice as recipients was performed as described in Materials and Methods. Recipient mice were injected intraperitoneally with 30 mg/kg of Gallium nitrate on the day of transplantation, day +1, +2, +3, and subsequently every other day until day 30. Cardiac allografts were monitored daily for survival. Results are expressed as percentage of mice with a viable allograft.
Figure 7.
Figure 7.
CCL17 expression is induced by various TLR ligands and correlates with IL-12 production. (A) Purified BM-derived DCs from CCL17E/+ mice were cultured for 15 h in the presence of the TLR ligands PAM3Cys, Poly-(I:C), LPS, and CpG-ODN or the proinflammatory cytokine TNF-α and EGFP expression was analyzed by flow cytometry. (B) Flow cytometric analysis of intracellular IL-12 production and EGFP expression in the same cultures as described in panel A. Representative data from one of three experiments are shown.
Figure 8.
Figure 8.
Accumulation of CCL17+ DCs upon LPS stimulation in various lymphoid organs, but absence of CCL17-expressing cells in the spleen during inflammatory responses. (A) Flow cytometric analysis of mLNs of unstimulated C57BL/6, control, and LPS-stimulated CCL17E/+ mice. DCs were prepared from collagenase digested mLNs from untreated mice or 15 h after LPS stimulation and enriched by MACS. Expression of CD11c, MHC class II (I-Ab), and CD86 were determined. The percentages of cells are indicated in each quadrant. Representative data from one of four independent experiments are shown. (B) MACS enriched DCs of PPs (top) and lung (bottom) of C57BL/6 control mice, unstimulated CCL17E/+ mice, and CCL17E/+ mice 15 h after LPS stimulation were gated as CD11c+ cells and analyzed for CCL17 expression. Values shown in the histograms represent the percentage of CCL17-positive cells. One representative of three experiments is shown. (C) Confocal analysis of cryostat sections of mLN (top) and spleen (bottom) from CCL17E/+ mice 15 h after injection of LPS or CpG-ODN, or 4 d after infection with Listeria monocytogenes, as indicated. (D) CCL17 expression is not induced in splenic DC of CCL17E/+ mice after in vitro stimulation. Flow cytometric analysis was performed on MACS purified splenic DCs after incubation with GMCSF and LPS, PAM3Cys, CpG-ODN, or αCD40 for 24 h. Cells were analyzed for CD11c and EGFP expression.

Similar articles

Cited by

References

    1. Steinman, R.M. 1991. The dendritic cell system and its role in immunogenicity. Annu. Rev. Immunol. 9:271–296. - PubMed
    1. Banchereau, J., F. Briere, C. Caux, J. Davoust, S. Lebecque, Y.J. Liu, B. Pulendran, and K. Palucka. 2000. Immunobiology of dendritic cells. Annu. Rev. Immunol. 18:767–811. - PubMed
    1. Shortman, K., and Y.J. Liu. 2002. Mouse and human dendritic cell subtypes. Nat. Rev. Immunol. 2:151–161. - PubMed
    1. Asselin-Paturel, C., A. Boonstra, M. Dalod, I. Durand, N. Yessaad, C. Dezutter-Dambuyant, A. Vicari, A. O'Garra, C. Biron, F. Briere, and G. Trinchieri. 2001. Mouse type I IFN-producing cells are immature APCs with plasmacytoid morphology. Nat. Immunol. 2:1144–1150. - PubMed
    1. Cyster, J.G. 1999. Chemokines and the homing of dendritic cells to the T cell areas of lymphoid organs. J. Exp. Med. 189:447–450. - PMC - PubMed

Publication types

MeSH terms