. 2003 Mar;15(3):719-31.
doi: 10.1105/tpc.009092.

Characterization of the last subunit of the Arabidopsis COP9 signalosome: implications for the overall structure and origin of the complex

Affiliations

Characterization of the last subunit of the Arabidopsis COP9 signalosome: implications for the overall structure and origin of the complex

Giovanna Serino et al. Plant Cell. 2003 Mar.

Abstract

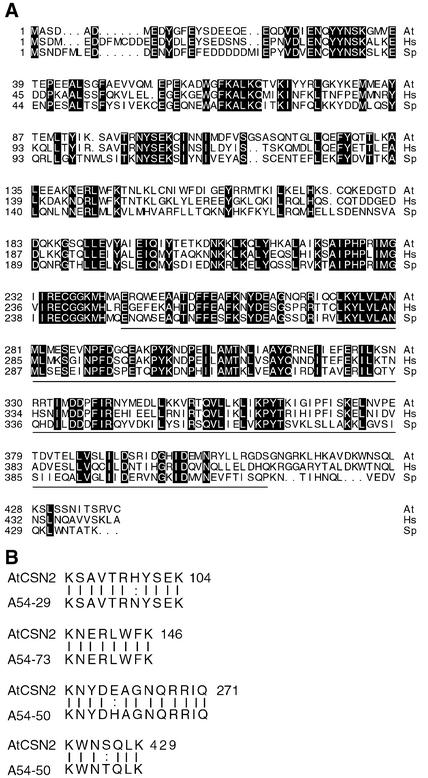
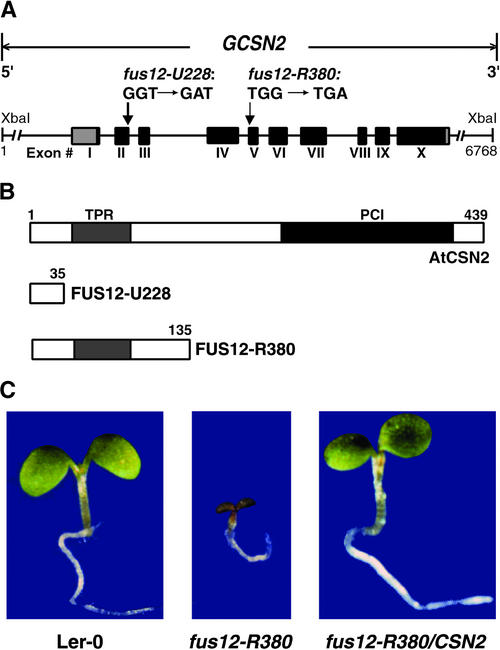
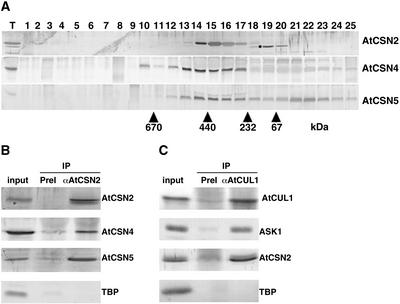
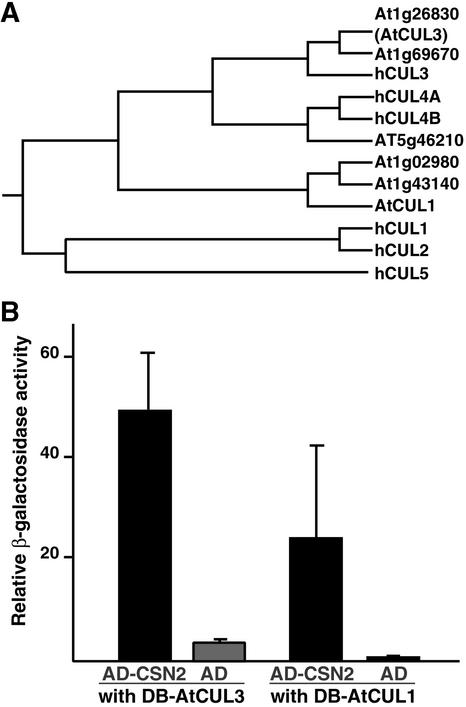
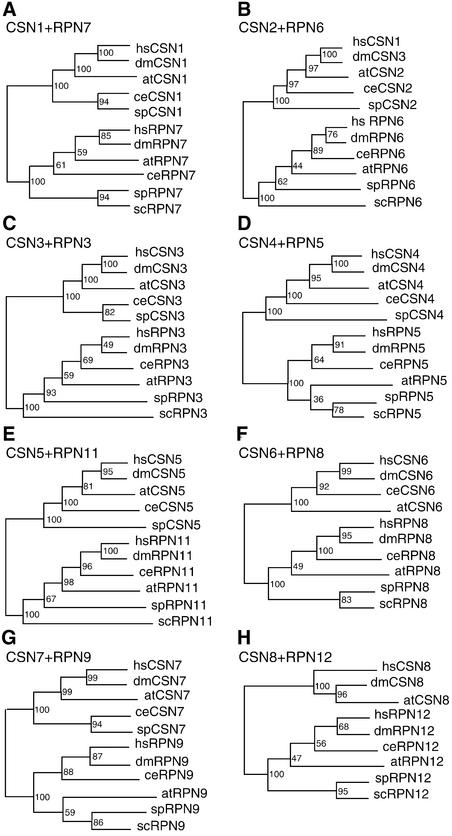
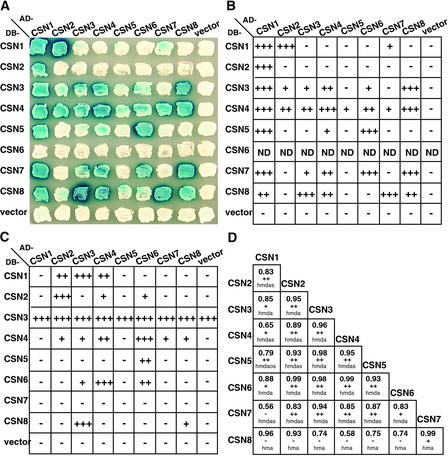
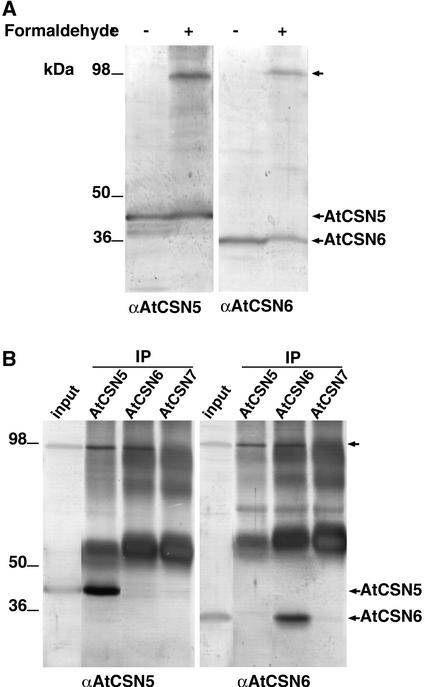
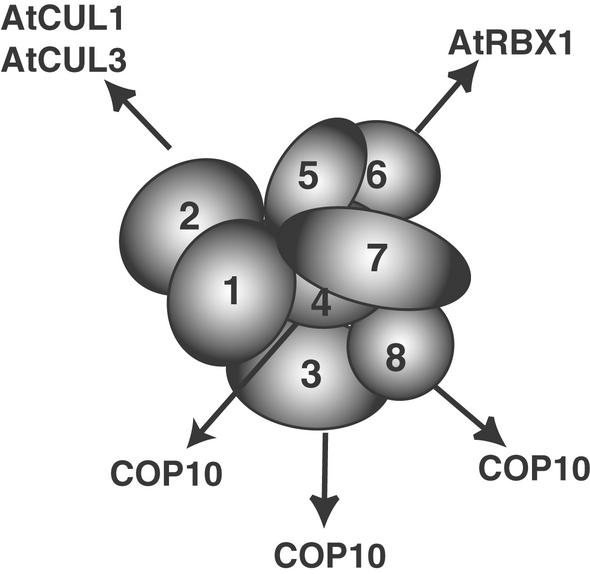
The COP9 signalosome (CSN) is an evolutionarily conserved protein complex that resembles the lid subcomplex of proteasomes. Through its ability to regulate specific proteasome-mediated protein degradation events, CSN controls multiple aspects of development. Here, we report the cloning and characterization of AtCSN2, the last uncharacterized CSN subunit from Arabidopsis. We show that the AtCSN2 gene corresponds to the previously identified FUS12 locus and that AtCSN2 copurifies with CSN, confirming that AtCSN2 is an integral component of CSN. AtCSN2 is not only able to interact with the SCF(TIR1) subunit AtCUL1, which is partially responsible for the regulatory interaction between CSN and SCF(TIR1), but also interacts with AtCUL3, suggesting that CSN is able to regulate the activity of other cullin-based E3 ligases through conserved interactions. Phylogenetic analysis indicated that the duplication and subsequent divergence events that led to the genes that encode CSN and lid subunits occurred before the divergence of unicellular and multicellular eukaryotic organisms and that the CSN subunits were more conserved than the lid subunits during evolution. Comparative analyses of the subunit interaction of CSN revealed a set of conserved subunit contacts and resulted in a model of CSN subunit topology, some aspects of which were substantiated by in vivo cross-link tests.


Figures

Figure 1.
Figure 1.
Comparison of the AtCSN2 Sequence with Its Homologs from Other Organisms. (A) Protein sequences of AtCSN2 (At) and its homologs from human (Hs) and S. pombe (Sp). Boxed residues indicate amino acid identity. The underlined sequence corresponds to the PCI domain of AtCSN2. Numbers at left indicate the positions of the first amino acid residues in each row. (B) Comparison of peptide sequences from cauliflower CSN2 with the corresponding AtCSN2 protein sequences. Vertical bars indicate identity. Numbers at left of the peptide sequences indicate HPLC fraction numbers. The numbers for the Arabidopsis peptides indicate the last amino acid positions in each row.
Figure 2.
Figure 2.
The FUS12 Locus from Arabidopsis Corresponds to the Gene That Encodes AtCSN2. (A) Genomic structure of the AtCSN2 locus and molecular nature of the mutations found in the fus12-U228 and fus12-R380 alleles. Introns are shown as lines; boxes and Roman numerals indicate exons. The 5′ and 3′ untranslated regions are shown by gray boxes, and the protein-encoding region is denoted by black boxes. A genomic fragment containing the complete genomic sequence of AtCSN2 together with its own promoter is indicated at top (GCSN2) and was used for the genetic complementation experiment. The two inserts are the mutated sequences found in fus12-R380 and fus12-U228. Numbers indicate base pairs (B) Wild-type and mutant versions of AtCSN2 proteins. The light gray boxes indicate the TPR homology region; the dark gray box indicates the location of the PCI domain. Numbers indicate amino acid positions. (C) Seedling phenotype of Landsberg wild type (Ler-0), fus12R380, and fus12-R380/CSN2, a representative line obtained by transforming the fus12-R380 mutant with GCSN2, indicating complementation of the mutant phenotype. All seedlings were grown in the light for 5 days.
Figure 3.
Figure 3.
AtCSN2 Is a Subunit of the COP9 Signalosome. (A) Gel filtration analysis of AtCSN2 and comparison with the elution profiles of two other CSN subunits, AtCSN4 and AtCSN5. Total soluble protein extracts from 5-day-old light-grown Columbia seedlings were separated by gel filtration and subjected to immunoblot analysis with antibodies to AtCSN2 (top gel; the dot indicates a cross-reacting protein), AtCSN4 (middle gel), and AtCSN5 (bottom gel). Lane T indicates the total extract; lanes 1 to 25 indicate the gel filtration elution fractions. Numbers below the arrowheads indicate the positions of molecular mass markers (kD). (B) AtCSN2 coimmunoprecipitates with other subunits of the COP9 signalosome. Total soluble protein extracts were mixed with AtCSN2 antibodies coupled to protein A beads (see Methods), and the immunoprecipitates (IP) were separated by SDS-PAGE. Antibodies used for immunoprecipitation are indicated at top, and antibodies used in the immunoblots are listed at right. PreI represents the preimmune serum from the same rabbit before immunization. (C) AtCSN2 coimmunoprecipitates with subunits of SCFTIR1. SCF complexes and their associated proteins were immunoprecipitated from total Arabidopsis protein extracts with AtCUL1 antibodies and subjected to immunoblot analysis with the antibodies listed at right. TBP antibodies were used to verify the specificity of the interactions.
Figure 4.
Figure 4.
AtCSN2 Interacts with Different Members of the Cullin Family. (A) Phylogenetic relationship of the six human cullins and their putative Arabidopsis homologs. The tree was generated using the CLUSTAL algorithm in the Megalign program (DNASTAR). (B) AtCSN2 interacts with AtCUL1 and AtCUL3. The interactions between AD-AtCSN2 and AtCUL1 or AtCUL3 fused to the DB are shown by black bars. The background controls (AtCUL1 or AtCUL3 interacting with AD alone) are indicated with gray bars. Numbers on the y axis are average values of at least six independent transformants. Error bars represent sd.
Figure 5.
Figure 5.
Evolutionary Relationships of CSN and Lid Subunits (RPN) from Selected Organisms. Numbers above the branches indicate support values. The GenBank accession numbers for the proteins listed are given in the supplemental data online. at, Arabidopsis thaliana; ce, Caenorhabditis elegans; dm, Drosophila melanogaster; hs, Homo sapiens; sc, Saccharomyces cerevisiae; sp, Schizosaccharomyces pombe.
Figure 6.
Figure 6.
Pair-wise Interaction Analysis among CSN Subunits. (A) Arabidopsis CSN subunit interactions detected by yeast two-hybrid assay. The eight CSN subunits from Arabidopsis were tested for potential interactions in both configurations (DB and AD). Dark blue color indicates lacZ production and thus protein interaction. (B) Colonies that tested positive for interactions in (A) were subjected to quantitative assays to verify the strength of the binding. − and + indicate the fold increase of β-galactosidase activity over the empty vector: −, 1-fold; +, 2- to 9-fold; ++, 10- to 49-fold; +++, 50- to 99-fold. ND, not determined. (C) An experiment similar to the one shown in (B) was performed with mammalian CSN subunits. (D) Correlation analysis of CSN subunits. Numbers indicate the Pearson's correlation coefficient. The signs below the numbers represent the statistical significance of the correlation: −, no significant correlation (P > 0.05); +, significant correlation (P < 0.05); ++, highly significant correlation (P < 0.01). Letters indicate the organisms used for the analysis: a, Arabidopsis thaliana; d, Drosophila melanogaster; h, Homo sapiens; o, Oryza sativa; s, Schizosaccharomyces pombe.
Figure 7.
Figure 7.
CSN5 and CSN6 Contact Each Other Physically within CSN. (A) The formaldehyde treatment of cauliflower inflorescences generates a high molecular mass protein complex (top arrow at right) on SDS-PAGE that is recognized by the antibodies to AtCSN5 and AtCSN6 (indicated at bottom). (B) The high molecular mass complex (top arrow at right) can be immunoprecipitated by antibodies to both AtCSN5 and AtCSN6 but not by antibodies to AtCSN7. Antibodies used for immunoprecipitation (IP) are indicated at top. The immunoblot analysis was performed with the antibodies indicated at bottom.
Figure 8.
Figure 8.
CSN Regulates Proteins of the Ubiquitin-Proteasome Pathway by Specific Contacts through Distinct Subunits. CSN subunit contacts were defined by the interaction demonstrated in this work. Potential dimers of the same subunit are not shown, and the subunits are not drawn to scale.

Comment in

References

    1. Bendixen, C., Gangloff, S., and Rothstein, R. (1994). A yeast mating-selection scheme for detection of protein–protein interactions. Nucleic Acids Res. 22, 1778–1779. - PMC - PubMed
    1. Blatch, G.L., and Lassle, M. (1999). The tetratricopeptide repeat: A structural motif mediating protein-protein interactions. Bioessays 21, 932–939. - PubMed
    1. Chamovitz, D.A., Wei, N., Osterlund, M.T., von Arnim, A.G., Staub, J.M., Matsui, M., and Deng, X.W. (1996). The COP9 complex, a novel multisubunit nuclear regulator involved in light control of a plant developmental switch. Cell 86, 115–121. - PubMed
    1. Cope, G.A., Suh, G.S., Aravind, L., Schwarz, S.E., Zipursky, S.L., Koonin, E.V., and Deshaies, R.J. (2002). Role of predicted metalloprotease motif of Jab1/Csn5 in cleavage of NEDD8 from CUL1. Science 298, 608–611. - PubMed
    1. Fraser, H.B., Hirsh, A.E., Steinmetz, L.M., Scharfe, C., and Feldman, M.W. (2002). Evolutionary rate in the protein interaction network. Science 296, 750–752. - PubMed

Publication types

MeSH terms