. 2003 Mar;57(3):681-93.
doi: 10.1016/s0008-6363(02)00725-3.

Nonuniform Ca2+ transients in arrhythmogenic Purkinje cells that survive in the infarcted canine heart

Affiliations

Nonuniform Ca2+ transients in arrhythmogenic Purkinje cells that survive in the infarcted canine heart

Penelope A Boyden et al. Cardiovasc Res. 2003 Mar.

Abstract

Objective and methods: In this study, we investigated whether Ca(2+) transients are altered in Purkinje cell aggregates dispersed from the subendocardium overlying the infarcted zone of the left ventricle (IZPCs) 48 h after coronary artery occlusion. To do so, we combined epifluorescent imaging with microelectrode recordings of IZPCs and normal canine Purkinje cell aggregates (NZPCs).

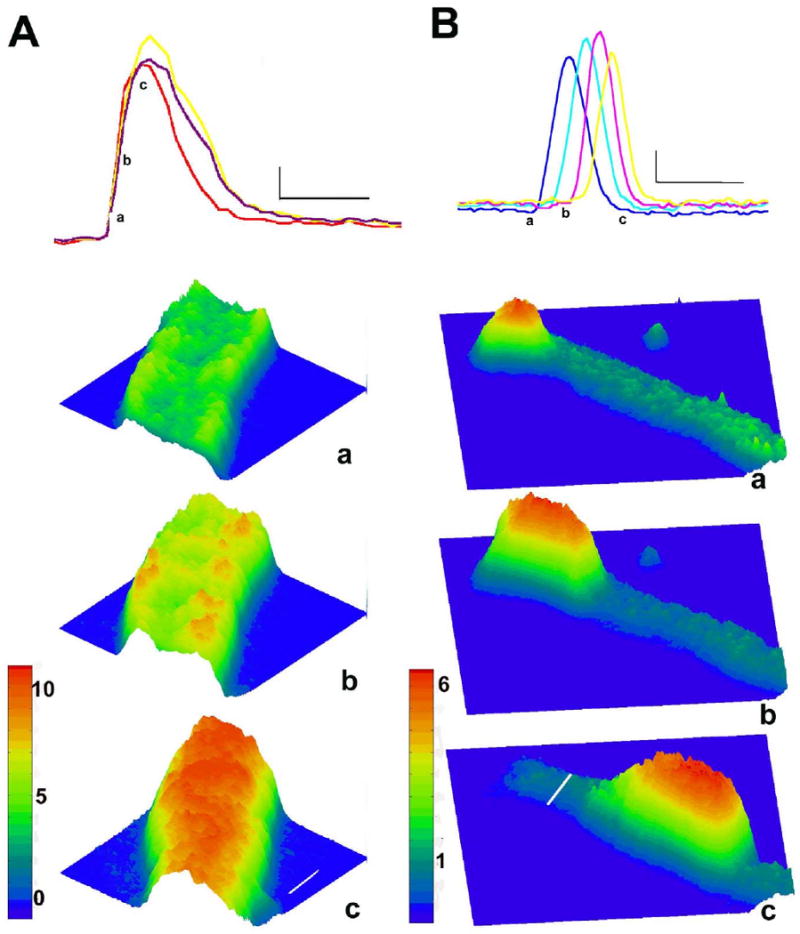
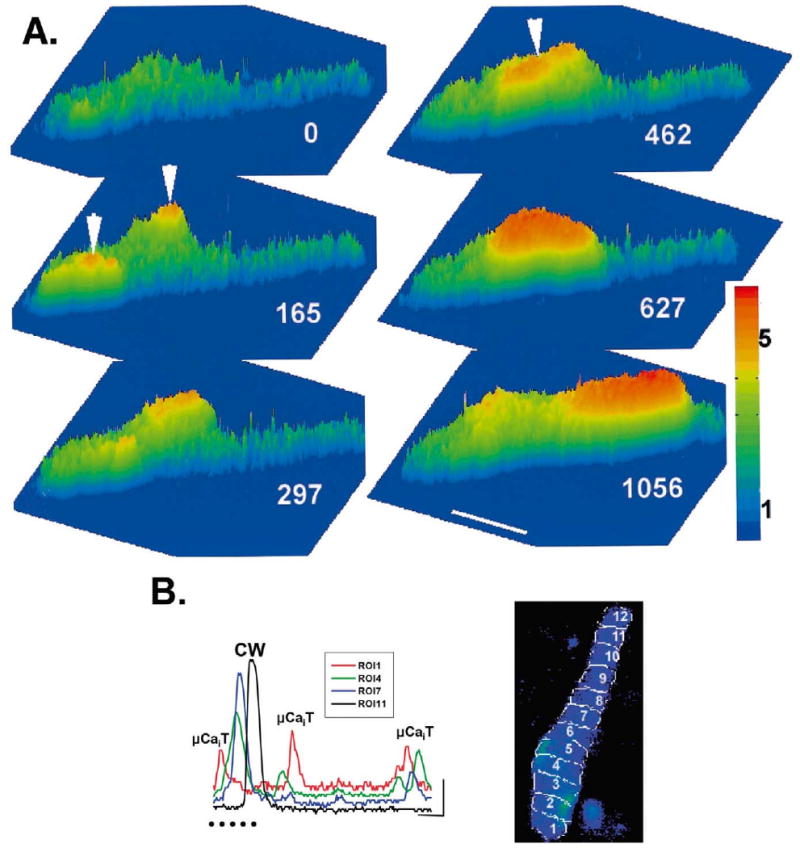
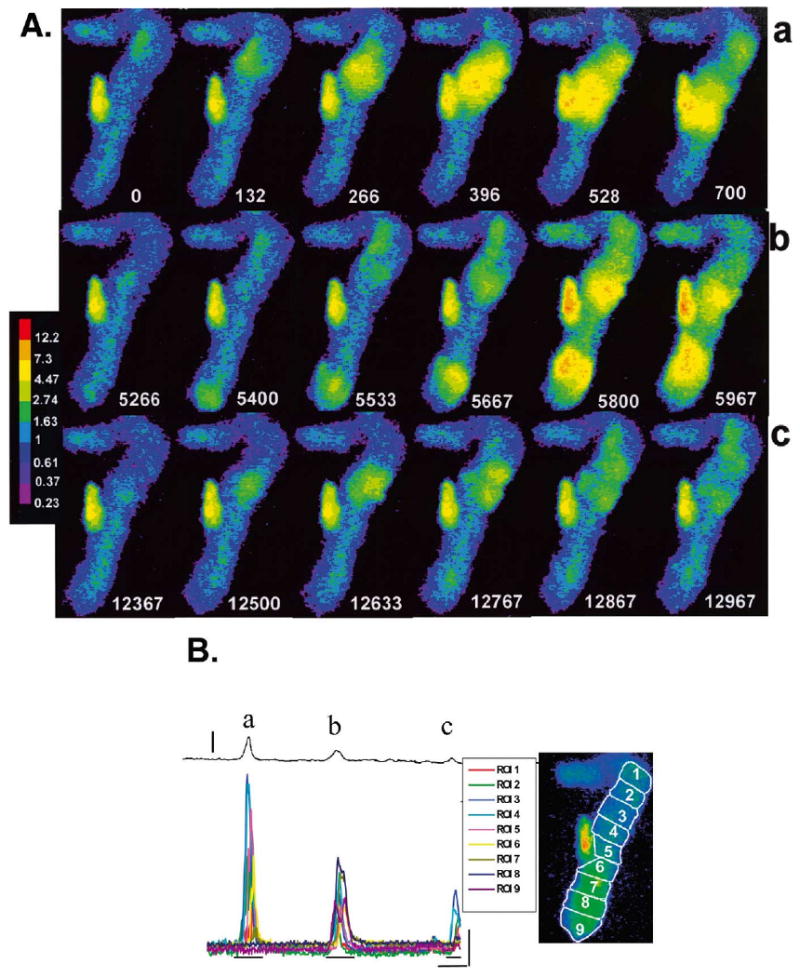
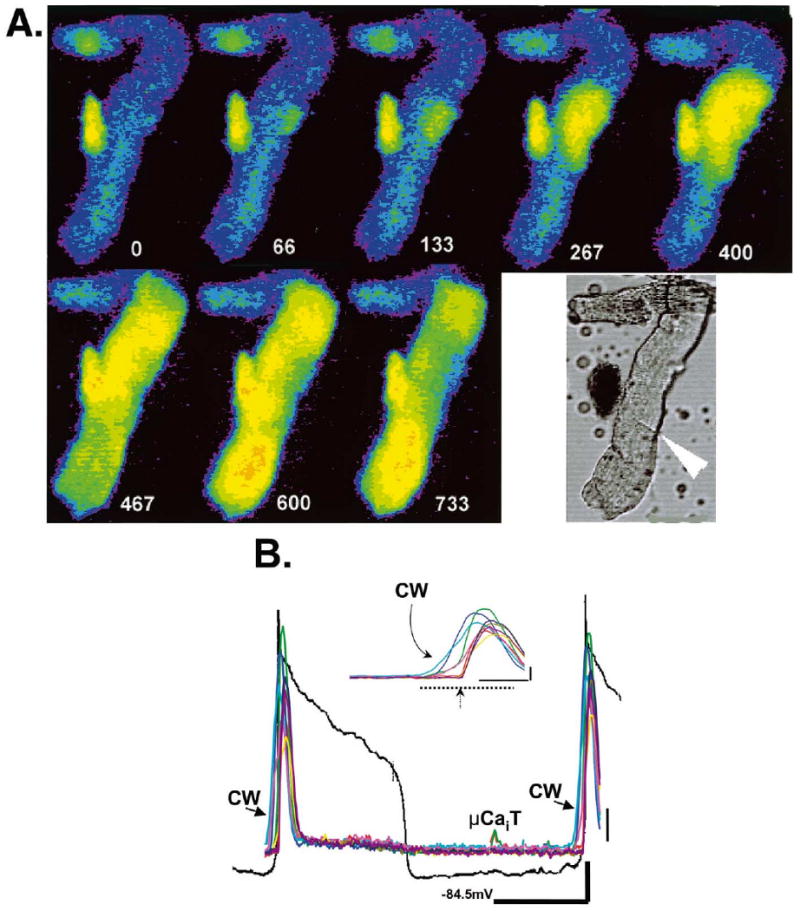
Results: NZPCs respond to an action potential (AP) by a small Ca(2+) transient at the cell surface immediately after the AP upstroke followed by a large [Ca(2+)] transient, which propagates to the cell core. In addition, focal Ca(2+) waves can originate spontaneously later during the AP or during the diastolic interval (Circ Res 2000;86:448-55) and then propagate throughout the aggregate as 'cell-wide Ca(2+) waves'. Electrically-evoked Ca(2+) transients in IZPCs arose significantly faster than those in NZPCs, and showed substantial spatiotemporal nonuniformity within an IZPC aggregate as well as between IZPC aggregates. IZPCs showed, hitherto undetected, low amplitude, micro Ca(2+) transients (extent <or=5 microm) at a fivefold higher incidence than in NZPCs. Micro Ca(2+) transients appeared to meander over distances <or=100 microm and reduced the local Ca(2+) transient of the next paced beat. Micro Ca(2+) transients nearly always preceded the cell-wide Ca(2+)waves, which occurred more frequently in IZPCs than in NZPCs and caused non-driven electrical activity of the Purkinje aggregate.

Conclusions: Micro Ca(2+) transients preceded cell-wide Ca(2+) waves so often that it is probable that micro Ca(2+) transients induced cell-wide Ca(2+) waves. Cell-wide Ca(2+) waves, in turn, clearly elicited spontaneous APs. We propose that the high incidence of micro Ca(2+) transients in IZPCs is a fundamental element of the abnormal Ca(2+) handling of diseased Purkinje cells, underlying arrhythmias originating in the subendocardial Purkinje network post myocardial infarction.


Figures

Fig. 1
Fig. 1
AP-evoked Ca2+ transients are robust and synchronous in NZPC aggregates. During the interval between stimuli, NZPC aggregates are quiescent, except for occasional large Ca2+ waves, which propagate along the cells of the aggregates. Top of each panel shows fluorescence intensity (Ca2+ changes) in two NZPCs during electrically-evoked depolarization (panel A) and a spontaneous Ca2+ wave (panel B). In panel A, fluorescence during an electrically-evoked Ca2+ transient in three ROIs is indicated. Small letters correspond to 3D surface plots (below) of ratio images of a section of this aggregate during the transient. Ca2+ concentration is reflected by both the color and height of the surface. The first response to a stimulus is an increase in Ca2+ (panel Aa), which is present mostly at the aggregate's periphery (panel Ab). Peak Ca2+ change occurs later in core of aggregate (panel Ac). Thin calibration bars correspond to 1 F/F0 unit and 333 ms, respectively, while white lines on surface plot (Panel Ac) correspond to 10 μm. In panel B, a spontaneous cell-wide Ca2+ wave moving along four ROIs of an NZPC is indicated. Small letters correspond to 3D surface plots (below) of a section of this aggregate during the Ca2+ wave. Note that a small Ca2+ transient appears at the edge of aggregate (panel Ba) and induces a Ca2+ wave, which propagates with a flat wave front along the full extent of aggregate until it self terminates (not shown). Thin calibration bars correspond to 1 F/F0 unit and 833 ms, respectively, while thick white line (panel Bc) corresponds to 26 μm for all surface plots. Color bars indicating fluorescence ratio are shown to left of surface plots.
Fig. 2
Fig. 2
AP-evoked Ca2+ transients in IZPCs are nonuniform. (Panel A) 3D surface plots of IZPC during the stimulus (S) in panel B. Ca2+ concentration is denoted by both the color and height of the surface. White number indicates time of frame where t=0 is frame just preceding t=33 ms frame. Plot in panel Aa corresponds to IZPC's first response to stimulus and panel Ab shows the nonuniform Ca2+ release at the aggregate's periphery. Panel Ac shows a small area of aggregate where Ca2+ is in core. Color bar to right indicates ratio range. (Panel Ba) Changes in intensity of fluorescence (F/F0) in six ROIs (outlined in white in above image) in IZPC of panel A. Changes in intensity at the edges and a center ROIs (outlined in red)in this IZPC are in panel Bb. Note in response to S, the peak of the center transient does not occur later than that of the edge transients consistent with lack of Ca2+ wave propagation from edge to core. Vertical and horizontal lines in Ba indicate 1 F/F0 and 833 ms, respectively. Vertical and horizontal lines in Bb depict 1 F/F0 unit and 330 ms, respectively. White line on image denotes 20 μm.
Fig. 3
Fig. 3
The AP-profile in IZPCs is usually triangular in shape. Time course of transmembrane action potentials (thick black lines) of an NZPC (upper panel) and an IZPC (lower panel) and concomitant changes in F/F0 at several ROIs during paced beats. Each ROI is represented by a different color. Note the sustained level of Ca2+ during the AP plateau in the NZPC (asterisk). Upon repolarization Ca2+ slowly returns to a diastolic level (dotted line). In the IZPC triangulated action potential (see also Fig. 7B), note the gradual decay of Ca2+. Thin vertical lines are 25 mV. Thick vertical line and horizontal line are 1 F/F0 unit, 1 s, respectively.
Fig. 4
Fig. 4
Nonuniformly occurring micro Ca2+ transients cause nonuniformity of the Ca2+ response of an IZPC aggregate to an AP. (Panel A) 3D surface plots of IZPC just preceding and during an electrically-evoked Ca2+ transient. [Ca2+ ] is denoted by both the color and height of the surface. White numbers indicate time of frame relative to t=0 (Aa). The aggregate was stimulated just before t=900 ms (Ad). Note the presence of micro Ca2+ waves (arrowheads), which propagate over short distances (t=0 to 467 ms) meandering from the right section of the aggregate toward the core. Subsequent stimulation causes nonuniform electrically-evoked local Ca2+ transients (t=900 ms) particularly in regions where micro Ca2+ waves had been. Horizontal bar indicates 50 μm. Color bar indicates ratio range. (Panel B) Changes in intensity of fluorescence (F/F0) at two selected ROIs in IZPC aggregate of panel A. Stimuli are indicated (S). Each ROI is represented by a different color and location is noted in upper image. Persistent fluorescence such as that seen in ROI 7 is not included in analysis. Note that when the micro Ca2+ transients (μCaiT) observed in ROI4 (see arrowheads of panel A) precede S, the subsequent Ca2+ transient of S is diminished compared to that of the previous S. Note that in ROIs where micro Ca2+ transients were absent (e.g., ROI 9), response to stimulation was constant. Vertical and horizontal lines are 1 F/F0 units and 1.58 s, respectively.
Fig. 5
Fig. 5
Spontaneous micro Ca2+ transients in IZPCs can lead to macroscopic Ca2+ waves. (Panel A) 3D surface plots of IZPC showing spontaneous Ca2+ release. Ca2+ concentration is denoted by both the color and height of the surface. White numbers indicate time relative to first frame of this sequence. Note the occurrence of micro Ca2+ transients starting in ROIs 1 and 4 (arrowheads) at t=165 to 462 ms and propagating but not throughout the entire aggregate; at t=462 ms, they appear to merge and initiate a larger cell-wide Ca2+ wave (t=627 ms). This wave propagates through the remainder of the aggregate (t=1056 ms) toward ROI 11. Horizontal bar indicates 50 μm. Color bar indicates ratio range. (Panel B) Changes in intensity of fluorescence (F/F0) in four ROIs (1, 4, 7, 11) during micro Ca2+ transients (μCaiT) and cell wide (CW) Ca2+ waves in the IZPC of panel A. Each ROI is represented by a different color. Position of ROI is shown in image of aggregate. 3D surface plots of panel A derived from images during time indicated by row of dots. Vertical and horizontal lines are 1 F/F0 unit and 833 ms, respectively.
Fig. 6
Fig. 6
Ca2+ waves lead to depolarizations. The magnitude of the depolarization corresponds to the [Ca2+ ] and extent of the Ca2+ transients. (Panel A) Selected F/F0 image frames from an IZPC and concomitant membrane depolarizations (panel B). Relative time (t=0 first frame) are white numbers. In panel Aa sequence, t=0 to 700 ms corresponds to F/F0 during a large Ca2+ wave (see also a, panel B); In panel Ab, t=5266 to 5967 ms corresponds to F/F0 during two smaller waves which occur nearly simultaneously and propagate toward center of aggregate but stop before colliding (b, panel B); in panel Ac, t=12 367 to 12 967 ms corresponds to small micro Ca2+ transients which meander along upper section of aggregate (c, panel B). Color bar indicates ratio values. (Panel B) Transmembrane potential changes (thin black line above) and changes in F/F0 of ROIs in the spontaneously active IZPC of panel A. Amplitude as well as spatial extent of the waves (see panel A) varied considerably, giving rise to a corresponding membrane depolarization (denoted by a, b, c). Vertical line 15 mV. Image to right indicates positions of ROIs for this panel and panel 7B. Thin vertical and horizontal lines correspond to 1 F/F0 and 1667 ms, respectively. Image frames of panel A derived from sections indicated by thin horizontal lines under Ca2+ tracings.
Fig. 7
Fig. 7
Large extensive Ca2+ waves lead to sufficient depolarization to elicit an AP and thus precede the ensuing electrically-evoked Ca2+ transient. (Panel A) Selected F/F0 image frames from the same IZPC shown in Fig. 6 but during Ca2+ wave induced electrical activity. Time relative to t=0 of first frame is depicted by white numbers. Lower right image is bright field image of this aggregate early during experiment. The arrow denotes a probable cell border. Color code as in Fig. 6A. (Panel B) Transmembrane potential changes (black line) and changes in F/F0 in several ROIs of spontaneously active IZPC of panel A (MDP= −84.5 mV). Nondriven action potentials are triggered by the large cell wide Ca2+ waves (CW). Inset shows enlargement of the Ca2+ wave preceding synchronized Ca2+ release induced by the second action potential (arrow). Images presented in panel A are derived from those occurring during time of dotted line. Note that a micro Ca2+ transient (μCaiT) occurs between the nondriven beats. Thick vertical and horizontal lines are one F/F0 unit and 3 s (1 F/F0, 417 ms for inset), respectively. Thin vertical black line is 12 mV.

References

    1. Boyden PA, Pu J, Pinto JMB, Ter Keurs HEDJ. Ca2+ transients and Ca2+ waves in Purkinje cells. Role in action potential initiation. Circ Res. 2000;86:448–455. - PMC - PubMed
    1. Janse MJ, Wit Al. Electrophysiological mechanisms of ventricular arrhythmias resulting from myocardial ischemia and infarction. Physiol Rev. 1989;69:1049–1169. - PubMed
    1. Pinto JMB, Boyden PA. Electrophysiologic remodeling in ischemia and infarction. Cardiovasc Res. 1999;42:284–297. - PubMed
    1. Harris AS. Delayed development of ventricular ectopic rhythms following experimental coronary occlusion. Circulation. 1950;1:1318–1328. - PubMed
    1. Boyden PA, Albala A, Dresdner K. Electrophysiology and ultrastructure of canine subendocardial Purkinje cells isolated from control and 24 hour infarcted hearts. Circ Res. 1989;65:955–970. - PubMed

Publication types