. 2003 Mar;13(3):369-81.
doi: 10.1101/gr.490303.

Segmental duplications in euchromatic regions of human chromosome 5: a source of evolutionary instability and transcriptional innovation

Affiliations

Segmental duplications in euchromatic regions of human chromosome 5: a source of evolutionary instability and transcriptional innovation

Anouk Courseaux et al. Genome Res. 2003 Mar.

Abstract

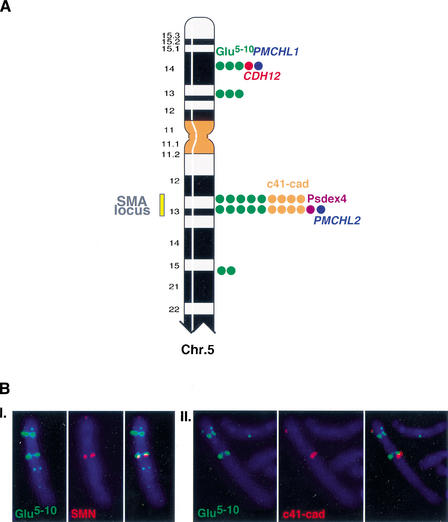
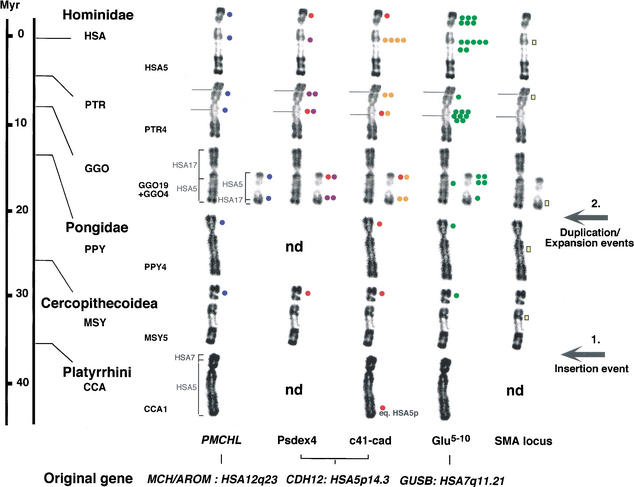
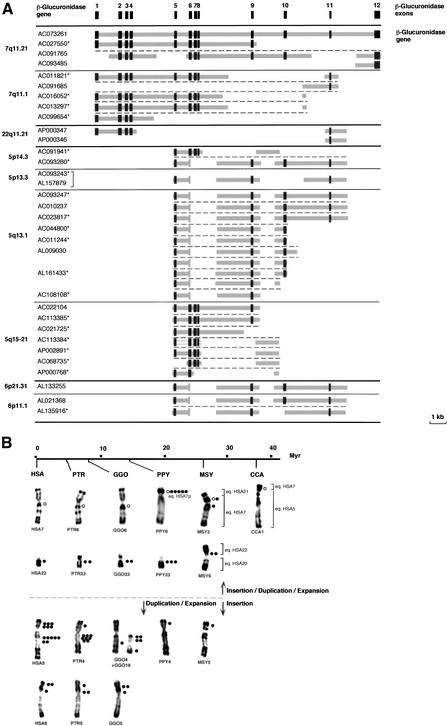
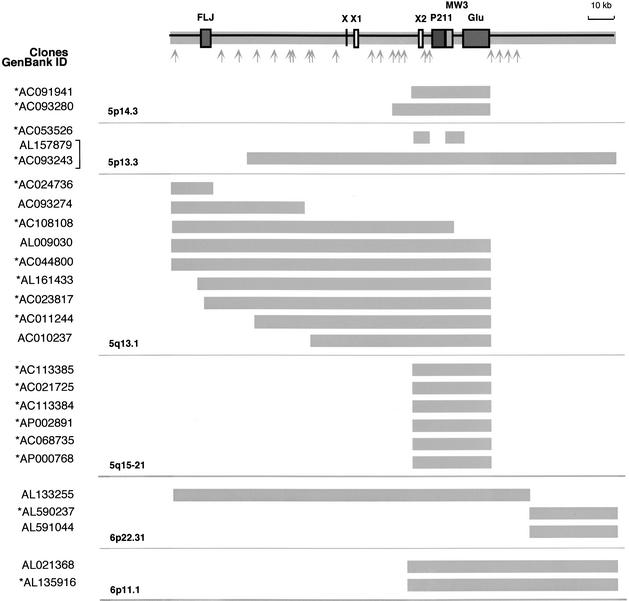
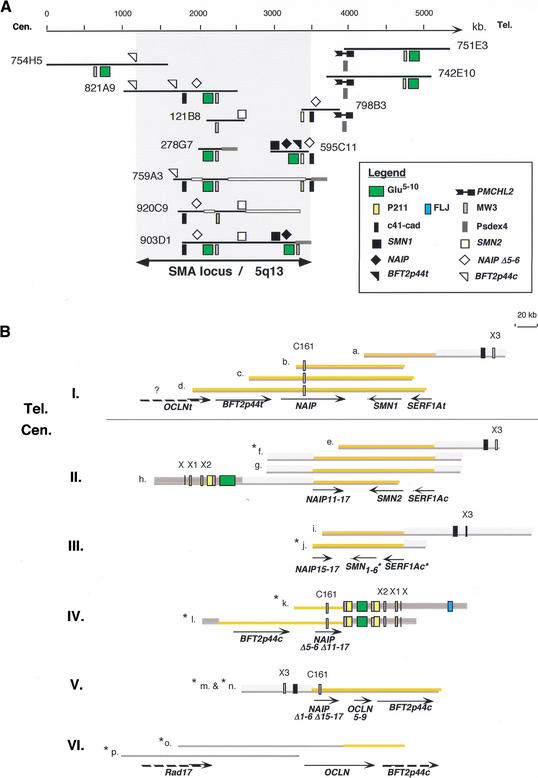
Recent analyses of the structure of pericentromeric and subtelomeric regions have revealed that these particular regions of human chromosomes are often composed of blocks of duplicated genomic segments that have been associated with rapid evolutionary turnover among the genomes of closely related primates. In the present study, we show that euchromatic regions of human chromosome 5-5p14, 5p13, 5q13, 5q15-5q21-also display such an accumulation of segmental duplications. The structure, organization and evolution of those primate-specific sequences were studied in detail by combining in silico and comparative FISH analyses on human, chimpanzee, gorilla, orangutang, macaca, and capuchin chromosomes. Our results lend support to a two-step model of transposition duplication in the euchromatic regions, with a founder insertional event at the time of divergence between Platyrrhini and Catarrhini (25-35 million years ago) and an apparent burst of inter- and intrachromosomal duplications in the Hominidae lineage. Furthermore, phylogenetic analysis suggests that the chronology and, likely, molecular mechanisms, differ regarding the region of primary insertion-euchromatic versus pericentromeric regions. Lastly, we show that as their counterparts located near the heterochromatic region, the euchromatic segmental duplications have consistently reshaped their region of insertion during primate evolution, creating putative mosaic genes, and they are obvious candidates for causing ectopic rearrangements that have contributed to evolutionary/genomic instability.


Figures

Figure 1.
Figure 1.
(A) Colocalization of the gene-derived sequences on human chromosome 5. The FISH hybrization signals observed on human chromosome 5 with gene segment-specific probes are represented by colored dots. (Blue) PMCHL genes; (green) Glu 5–10; (red) Br-cadherin gene (CDH12); (orange) c41-cad; (purple) Psdex4. The number of dots is proportional to the signal intensity, which was scored on a scale of from 0–5. The yellow bar delimits the predisposition locus to the SMA disease. (B) Illustration of some dual-color FISH experiments. (I.) Glu 5–10 biotin-labeled (5F10R probe)/SMN digoxigenin-labeled (132SE23 probe, specific to the SMN gene in the SMA locus), (II.) Glu 5–10 biotin-labeled (5F10R probe)/c41-cad digoxigenin-labeled (Φ-98-1 probe). The hybridization signals observed on 5p with the c41-cad probe are due to cross-hybridization with the genuine CDH12 gene.
Figure 2.
Figure 2.
Summary of the in situ hybridization results of the gene-derived sequences/SMA genes on human and other primate chromosomes equivalent to human chromosome 5 (HSA5). The scale indicates the generally accepted times of divergence of Anthropoids from the human lineage (Hacia 2001). On the basis of the phylogenetic classification of Goodman (1999), we placed Pongo in the family Pongidae and grouped Gorilla, Pan, and Homo in the family Hominidae. The same color code as in Figure 1 was used. The number of dots indicates the average signal intensity observed at a given location with a particular clone. Red dots on Psdex4 and c41-cad hybridization patterns indicate cross-hybridization with the genuine CDH12 gene. The names and chromosomal localizations of the original genes, whose gene segments derived from are indicated at bottom. The yellow bar indicates hybrization signals obtained with two genes (SMN and NAIP) specific to the SMA locus. The position of the homologs to human SMA locus is indicated as a chromosomal index of the region equivalent to HSA 5q13. Brackets indicate the homology between HSA and other primate chromosomes. For Cebus capucinus (CCA), CCA1 is formed by the equivalent of the whole HSA5, plus a small segment of HSA7 (Richard et al. 1996). For Macaca sylvana (MSY) and Pongo pygmaeus (PPY), the equivalent to HSA5 (MSY5 and PPY4, respectively) have a banding pattern very similar to HSA5 (Dutrillaux 1979). For Gorilla gorilla (GGO), GGO4 and GGO19 are the products of a reciprocal translocation between ancestral chromosomes equivalent to HSA5 and HSA17, respectively (Dutrillaux et al. 1973). Evolutionary breakpoints occurred in regions equivalent to HSA5q13.3 and HSA17p12 (Stankiewicz et al. 2001). Brackets indicate the homology between GGO and HSA chromosomes. For Pan troglodytes (PTR), PTR4 differs from HSA5 by a pericentromeric inversion, inv(5)(p14.3;q13.3) (Yunis and Prakash 1982; Marzella et al. 1997). Grey lines on PTR chromosomes indicate the pericentromeric inversion breakpoints.
Figure 3.
Figure 3.
(A) Schematic representation of the genomic structure of the β-glucuronidase gene (GUSB) and GUSB-derived paralogous sequences. The genomic structure of the GUSB gene was established according to sequence comparison and alignment between the β-glucuronidase mRNA complete sequence (M15182) and genomic sequence of the BAC clone RP11-252P18 (). Dark gray boxes indicate the exons, and thick light-gray lines indicate intervening intronic sequences. For each GUSB-derived sequence found in the draft sequence of the human genome, the chromosomal localization and the GeneBank ID of the clone(s) they were derived from are indicated. (*) Clones in HTGS phase in GenBank—according to the June 2002 freeze of the genome draft sequence. Horizontal black bold lines illustrate chromosomal separations, horizontal black plain lines, subchromosomal separations, and horizontal black broken lines, gene-copy separations. The bracket indicates that the same clone was sequenced twice. (B) Summary of the in situ hybridization results obtained with a Glu 5–10 cosmid probe on human (HSA) and other primate chromosomes. A molecular timescale for primate evolution is indicated. The number of dots indicates the average signal intensity observed at a given location, resulting from the number of loci and the hybridization efficiency. The brackets illustrate the homologies between Macaca or Cebus and human chromosomes. In the presumed ancestral karyotype of placental mammals, the HSA7 homolog was composed of two parts. These two components fused before the separation of Cercopithecoidea and Hominidae (∼25 Mya), and then pericentric and paracentric inversions occurred in the Hominidae lineage. Thus, HSA7 is a fairly recent chromosome shared by HSA and PTR only. In Cebus capucinus, the smallest part homolog to HSA7 is on CCA1 associated with the homolog to the whole HSA5 (Richard et al. 1996). In Macaca sylvana, MSY2 is formed by the equivalents of the whole HSA7 and HSA21, and MSY9 by the equivalents of HSA20 and HSA22 (Muleris et al. 1984). HSA22/PTR23/GGO23/PPY23 on one hand, and HSA6/PTR5/GGO5 on the other hand, differ mostly only by heterochromatic variations (Yunis and Prakash 1982). The differences in the chronology of expansion/spreading of the GUSB paralogous sequences is depicted by a horizontal broken line, top, primo-insertion in pericentromeric regions on ancestral HSA7 and HSA22, bottom, primo-insertion in the ancestral HSA5p euchromatic region.
Figure 4.
Figure 4.
Paralogy map and sequence content of the HSA5/HSA6 duplicon. The genomic organization of the duplicated region was deduced from the and clones that were chosen as reference seed sequence. The thick gray lines illustrate the homology extent between paralogous loci. The chromosomal localization and the GeneBank ID of the clones are indicated. The P211, FLJ, and GUSB gene-derived sequences are boxed in dark gray. For exon-intron organization of the GUSB-derived sequences, see Figure 3A. The THE-1 transposable element MW3 is boxed in light gray. X, X1, and X2 are sequences paralogous to exons of the chimeric genes described in Figure 6. Gray arrows indicate the localization of sequences highly homologous (>95%) to ESTs and human UNIGENE clusters as follows: Hs.186379, Hs.312136, Hs.224604, Hs.145839, Hs.274528, Hs.297663, Hs.50454, Hs.202243, Hs.183256, Hs.132586, , , Hs.317160, Hs.326016, Hs.121081, Hs.294040, Hs.166361, Hs.321499, Hs.324135, Hs.7569, Hs.131950, and Hs.186180. The brackets indicate that the same clone was sequenced twice. (*) Clones in HTGS phase in GenBank—according to the June, 2002 freeze of the genome draft sequence.
Figure 5.
Figure 5.
Genomic organization of the SMA locus on 5q13. (A) Consensus YAC contig spanning the SMA region. Genes of the locus (SMN, NAIP, and BFTp44) are symbolized on the black line representing the extent of the clones, and the PSVs underneath. Legend at right. Thick gray and white lines symbolize YAC chimerism and instability, respectively. (B) Genomic organization of the SMA locus established through sequence analysis of PAC/BAC clones (a–p). Despite the fact that critical pieces of information about this chromosomal region are still missing or unclear, we succeeded in reconstructing the sequence organization of six nonoverlapping genomic areas encompassing the disease locus (I. to VI.). Tel. and Cen. refer, respectively, to the telomeric and centromeric parts of the duplication as described in the literature. Sequences specific to this duplicon are highlighted in orange. Thick gray lines represent duplicons whose original locus is on 5p14; (1) thick light-gray lines represent areas paralogous to the 5p14 region, and (2) thick dark-gray lines represent paralogous sequences distributed among several loci on human chromosomes 5 and 6 (see Fig. 4). Arrows indicate the extent and the 5′–3′ orientation of the genes. The NAIPΔ represent deleted forms of the NAIP gene. SMN1-6, NAIP11-17, and OCLN5-9 are deleted forms of the SMN, NAIP, and OCLN genes, respectively. (C161) CATT1-G1/C161 dinucleotide repeat marker (Burghes et al. 1994). (X, X1, X2, X3, C161) Sequences paralogous to exons of the chimeric genes depicted in Figure 6. Gene symbols and PSVs are denoted according to the symbol used in Figures 4 and 5A. (a) /CTC-340H12; (b) /GSP13996; (c) /125D9; (d) /RP11-195E2; (e) /D215P15; (f) /CTC-566F17; (g) /CTC-492P2; (h) /CTC-348J20; (i) /CTC-202F24; (j) /CTC-249C14; (k) /RP11-34J8; (l) /RP11-497H16; (m) /RP11-551B22; (n) /RP11-508M8; (o) /CTD-2027K22; (p) /RP11-2H18. (*) Clones in HTGS phase in GenBank—according to the June, 2002 freeze of the genome draft sequence.
Figure 6.
Figure 6.
Schematic representation of chimeric transcripts and potentially functional ORFs. Exonic sequences are boxed and were deduced from comparative analyses between the DNA sequences of the transcripts and genomic clones. Sequences highly similar (86%–100% identity) to other known gene-exonic sequences are colored as follows: green, GUSB derived; blue, OCLN derived; orange, NAIP derived. These exons are numbered according to the exonic sequences they are derived from, that is, N7, sequence paralogous to NAIP exon 7. GUSB-derived chimeric transcripts are drawn to scale. Regarding NAIP-OCLN-derived transcripts, only partial information was available. The 3′ part of these cDNAs was assigned previously as NAIP exon 17 (Roy et al. 1995). However, further in silico analysis revealed that the 3′ ends actually consisted of four exons homologous to OCLN exons 5–9, and were associated with the exonic sequence X4, whose genomic origin remains undetermined. (Rp) Repeated sequence as follows: (Rp.1) LTR/pTR5; (Rp.2) LINE/HAL1-SINE/Alu Sx; (Rp.3) MER3-SINE/Alu Y; (Rp.4) LTR/pTR5-LINE/L1. (C161) Exonic sequence containing the CATT1-G1/C161 dinucleotide repeat marker. Gray brackets numbered a–l indicate the extent of potentially functional ORFs initiated from an ATG codon in a reasonable initiation context (Kozak 1984). For genomic localizations of sequences paralogous to exons C161 and X3, see Figure 5B, and for exons X, X1, and X2, see Figures 4 and 5B.

References

    1. Bailey J.A., Yavor, A.M., Massa, H.F., Trask, B.J., and Eichler, E.E. 2001. Segmental duplications: Organization and impact within the current human genome project assembly. Genome Res. 11: 1005-1017. - PMC - PubMed
    1. Bailey J.A., Gu, Z., Clark, R.A., Reinert, K., Samonte, R.V., Schwartz, S., Adams, M.D., Myers, E.W., Li, P.W., and Eichler, E.E. 2002a. Recent segmental duplications in the human genome. Science 297: 1003-1007. - PubMed
    1. Bailey J.A., Yavor, A.M., Viggiano, L., Misceo, D., Horvath, J.E., Archidiacono, N., Schwartz, S., Rocchi, M., and Eichler, E.E. 2002b. Human-specific duplication and mosaic transcripts: The recent paralogous structure of chromosome 22. Am. J. Hum. Genet. 70: 83-100. - PMC - PubMed
    1. Brosius J. 1999a. RNAs from all categories generate retrosequences that may be exapted as novel genes or regulatory elements. Gene 238: 115-134. - PubMed
    1. ___, 1999b. Vertebrate genomes were forged by massive bombardments with retroelements and retrosequences. Genetica 107: 209-238. - PubMed

Publication types

LinkOut - more resources