. 2003 Mar;13(3):455-66.
doi: 10.1101/gr.885403.

15000 unique zebrafish EST clusters and their future use in microarray for profiling gene expression patterns during embryogenesis

Affiliations

15000 unique zebrafish EST clusters and their future use in microarray for profiling gene expression patterns during embryogenesis

Jane Lo et al. Genome Res. 2003 Mar.

Abstract

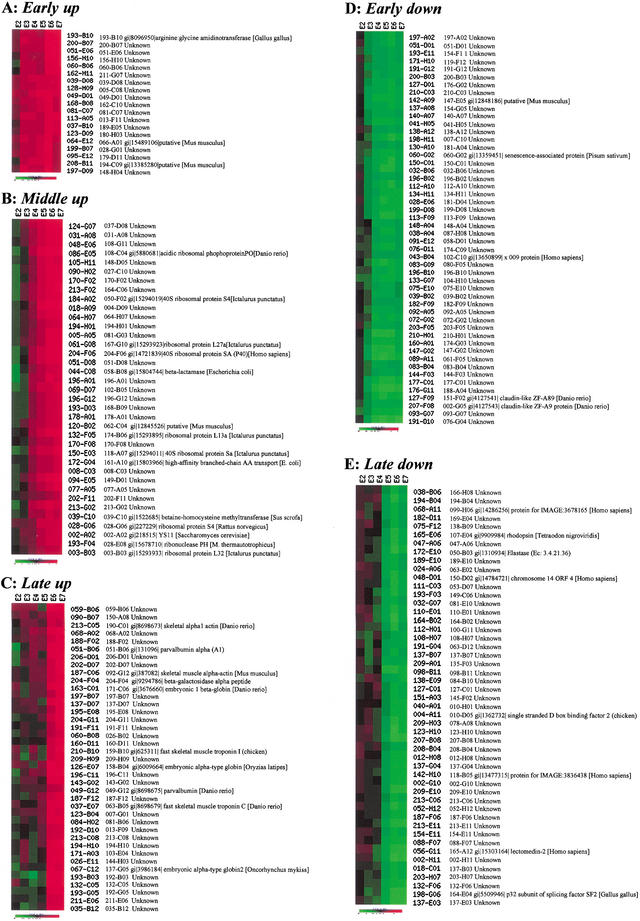
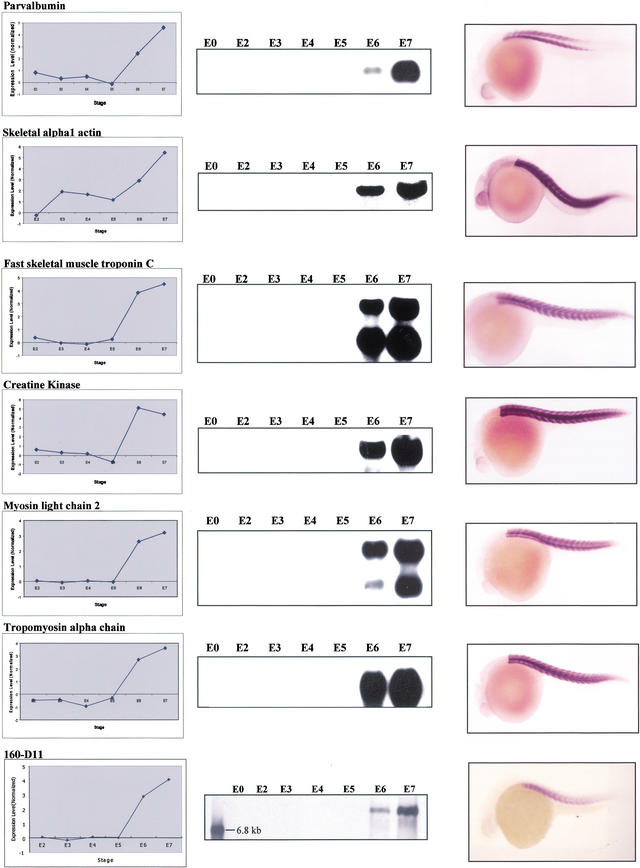
A total of 15590 unique zebrafish EST clusters from two cDNA libraries have been identified. Most significantly, only 22% (3437) of the 15590 unique clusters matched 2805 (of 15200) clusters in the Danio rerio UniGene database, indicating that our EST set is complementary to the existing ESTs in the public database and will be invaluable in assisting the annotation of genes based on the upcoming zebrafish genome sequence. Blast search showed that 7824 of our unique clusters matched 6710 known or predicted proteins in the nonredundant database. A cDNA microarray representing approximately 3100 unique zebrafish cDNA clusters has been generated and used to profile the gene expression patterns across six different embryonic stages (cleavage, blastula, gastrula, segmentation, pharyngula, and hatching). Analysis of expression data using K-means clustering revealed that genes coding for muscle-specific proteins displayed similar expression patterns, confirming that the coordinate gene expression is important for myogenesis. Our results demonstrate that the combination of microarray technology with the zebrafish model system can provide useful information on how genes are coordinated in a genetic network to control zebrafish embryogenesis and can help to identify novel genes that are important for organogenesis.


Figures

Figure 1.
Figure 1.
Procedure for cDNA normalization (for details, see Methods).
Figure 2.
Figure 2.
Construction of the normalized cDNA library (Z2). (A) Size selection of cDNA for normalization. (Left) Total cDNA before size selection, (right) size-selected cDNA. (B) Separation of ss-cDNA and ds-cDNA on hydroxyapatite column (HA column). ss-cDNA is eluted at 100 min and ds-cDNA is eluted at 150 min. (C) Colony hybridization to examine the normalization efficiency using the β-tubulin gene as a probe. (SI) Library constructed from prenormalized cDNA; (NIII) library constructed from cDNA after three rounds of normalization.
Figure 3.
Figure 3.
Examples of gene expression profiling during zebrafish embryogenesis using the K-means clustering method. For hierarchical and K-means clustering, Euclidean distance was applied to divide all expression data into 20 clusters. Of that, seven were selected to form five clusters (groups). The five groups were subjected to screening to get rid of the redundant cluster ID and annotation ID before the final presentation. (A) Patterns for genes significantly up-regulated at the E3 stage. (B) Patterns for genes significantly up-regulated at the E4 or E5 stages. The expression of most genes for ribosomal proteins displayed such patterns (Supplementary Fig. 2). (C) Patterns for genes significantly up-regulated at the E6 stage. The expression of many genes for muscle-specific proteins displayed such patterns (Supplementary Fig. 3). (D) Patterns for genes down-regulated at the E3 or E4 stages. (E) Patterns for genes down-regulated at the E5 or E6 stages. Samples of the various stages for microarray probe labeling and Northern blots were collected on the basis of the staging series as described in Kimmel et al. (1995). One to two stages were collected to represent one period of embryos. Altogether, seven periods were collected. E1, the zygotic period, was omitted in the experiment. (E0) Unfertilized; (E2) cleavage (four- to eight-cell); (E3) blastula (4–4⅓ h); (E4) gastrula (5¼ to 5formula image h); (E5) segmentation (6 to 10 somites); (E6) pharyngula (24 h); (E7) hatching (72 h). M. thermautotrophicus = Methanothermobacter thermautotrophicus.
Figure 4.
Figure 4.
Coordinated expression of genes for muscle-specific proteins. Expression patterns of six muscle-specific genes (clone ID: parvalbumin, 109-C11; skeletal alpha1 actin, 092-G12; fast skeletal muscle troponin C, 068-F03; creatine kinase, 144-H03; myosin light chain 2, 077-D05; tropomyosin alpha chain, 098-G11; putative novel muscle gene, 160-D11; all from the Z1 library) are shown. (Left panel) Patterns obtained from microarray hybridization; (middle panel) patterns obtained from RNA gel blot hybridization; (right panel) in situ hybridization to confirm the tissue-specific expression of these six genes in WT embryos.

References

    1. Amsterdam A., Burges, S., Golling, G., Chen, W., Sun, Z., Townsend, K., Farrington, S., Haldi, M., and Hopkins, N. 1999. A large-scale insertional mutagenesis screen in zebrafish. Genes & Dev. 13: 2713-2724. - PMC - PubMed
    1. Ando H., Furuta, T., Tsien, R.Y., and Okamoto, H. 2001. Photo-mediated gene activation using caged RNA/DNA in zebrafish embryos. Nat. Genet. 28: 317-325. - PubMed
    1. Barresi M.J.F., Stickney, H.L., and Devoto, S.H. 2000. The zebrafish slow-muscle-omitted gene product is required for Hedgehog signal transduction and the development of slow muscle identity. Development 127: 2189-2199. - PubMed
    1. Brown M.P.S., Grundy, W.N., Lin, D., Cristianini, N., Sugnet, C.W., Furey, T.S., Ares, M., Jr., and Haussler, D. 2000. Knowledge-based analysis of microarray gene expression data by using support vector machines. Proc. Natl. Acad. Sci. 97: 262-267. - PMC - PubMed
    1. Cho R.J., Campbell, M.J., Winzeler, E.A., Steinmetz, L., Conway, A., Wodicka, L., Wolfsberg, T.G., Gabrielian, A.E., Landsman, D., Lockhart, D.J., et al. 1998. A genome-wide transcriptional analysis of the mitotic cell cycle. Mol. Cell 2: 65-73. - PubMed

Publication types

MeSH terms

Associated data