Comparative Study
. 2003 Mar;13(3):513-23.
doi: 10.1101/gr.541303.

Large-scale identification of single-feature polymorphisms in complex genomes

Affiliations
Comparative Study

Large-scale identification of single-feature polymorphisms in complex genomes

Justin O Borevitz et al. Genome Res. 2003 Mar.

Abstract

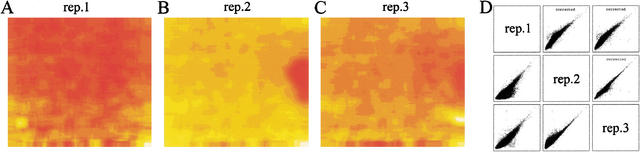
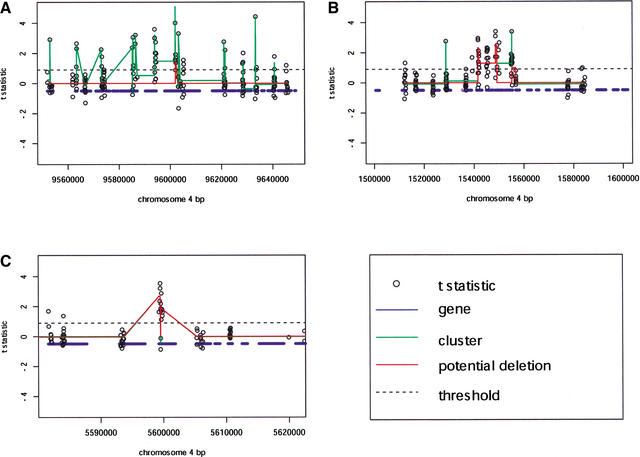
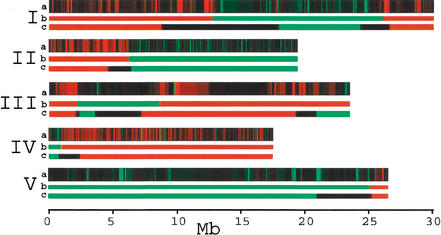
We have developed a high-throughput genotyping platform by hybridizing genomic DNA from Arabidopsis thaliana accessions to an RNA expression GeneChip (AtGenome1). Using newly developed analytical tools, a large number of single-feature polymorphisms (SFPs) were identified. A comparison of two accessions, the reference strain Columbia (Col) and the strain Landsberg erecta (Ler), identified nearly 4000 SFPs, which could be reliably scored at a 5% error rate. Ler sequence was used to confirm 117 of 121 SFPs and to determine the sensitivity of array hybridization. Features containing sequence repeats, as well as those from high copy genes, showed greater polymorphism rates. A linear clustering algorithm was developed to identify clusters of SFPs representing potential deletions in 111 genes at a 5% false discovery rate (FDR). Among the potential deletions were transposons, disease resistance genes, and genes involved in secondary metabolism. The applicability of this technique was demonstrated by genotyping a recombinant inbred line. Recombination break points could be clearly defined, and in one case delimited to an interval of 29 kb. We further demonstrate that array hybridization can be combined with bulk segregant analysis to quickly map mutations. The extension of these tools to organisms with complex genomes, such as Arabidopsis, will greatly increase our ability to map and clone quantitative trait loci (QTL).


Figures

Figure 1.
Figure 1.
Spatial correction of hybridization signals. The spatial correction applied to three replicate arrays is shown in false color (A–C). Some prominent spatial artifacts can be seen. Pairwise scatter plots (D) compare the log intensity of each feature between replicate arrays. Before spatial correction (bottom left three scatter plots), a shoulder can be seen mainly due to the large smudge on rep.2. After spatial correction (top right three scatter plots), this shoulder is almost completely removed, increasing the replicate correlation.
Figure 2.
Figure 2.
Distribution of t-statistics. The 92924 Col/Ler observed t-statistics are plotted against the expected “null” distribution (thick line). The dotted line represents a 5% FDR threshold. The dashed line represents an 18% FDR threshold.
Figure 3.
Figure 3.
Loci containing potential deletions. (A) A cluster of disease resistance-like genes shows high rates of polymorphism and contains potential gene deletions. (B) Other regions containing genes of unknown function are also highly polymorphic and contain potential gene deletions. (C) A potential deletion in a single RPS2-like disease resistance gene. Plots of the entire genome can be viewed at http://naturalvariation.org/sfp.
Figure 4.
Figure 4.
Genotype of RIL CL-33. The genotypes of 3806 SFPs were evaluated via chip hybridization as being Col (green), Ler (red), or unknown (black) for the RIL shown in the a chromosome. Color intensity represents the likelihood of each genotype (see Methods). A clustering algorithm was applied to determine the precise location of the recombination events according to the likelihood of each genotype. This is shown in bright green or red, b chromosome. Recombination breakpoints are clearly defined for chromosomes 2 and 4 because they are well covered on AtGenome1. The c chromosome shows the genotypes obtained from low-resolution PCR genotyping with 74 markers (www.natural-eu.org) for comparison. The unknown locations of the recombination events are shown in black, c chromosome.
Figure 5.
Figure 5.
Bulk segregant analysis. Hybridization of F2 pools was used to determine the predicted location of the erecta mutation. (Left) Solid circles show the LLR statistic at each cM. The maximum LLR (thick vertical line), is 3 cM away from the ERECTA gene (thin vertical line) on chromosome 2. Simulations were used to determine that the 95% confidence interval spanned 12 cM (dashed vertical lines). LLR scores on unlinked chromosomes (black solid circles). Most LLR scores are negative on unlinked chromosomes. Gray lines show the variation in LLR scores produced by simulations.

References

    1. Alderborn A., Kristofferson, A., and Hammerling, U. 2000. Determination of single-nucleotide polymorphisms by real-time pyrophosphate DNA sequencing. Genome Res. 10: 1249-1258. - PMC - PubMed
    1. Bell C.J. and Ecker, J.R. 1994. Assignment of 30 microsatellite loci to the linkage map of Arabidopsis. Genomics 19: 137-144. - PubMed
    1. Brem R.B., Yvert, G., Clinton, R., and Kruglyak, L. 2002. Genetic dissection of transcriptional regulation in budding yeast. Science 296: 752-755. - PubMed
    1. Cho R.J., Mindrinos, M., Richards, D.R., Sapolsky, R.J., Anderson, M., Drenkard, E., Dewdney, J., Reuber, T.L., Stammers, M., Federspiel, N., et al. 1999. Genome-wide mapping with biallelic markers in Arabidopsis thaliana. Nat. Genet. 23: 203-207. - PubMed
    1. Doerge R.W. 2002. Mapping and analysis of quantitative trait loci in experimental populations. Nat. Rev. Genet. 3: 43-52. - PubMed

Publication types

MeSH terms