. 2003 Mar;185(6):1923-34.
doi: 10.1128/JB.185.6.1923-1934.2003.

Design of antisense RNA constructs for downregulation of the acetone formation pathway of Clostridium acetobutylicum

Affiliations

Design of antisense RNA constructs for downregulation of the acetone formation pathway of Clostridium acetobutylicum

Seshu B Tummala et al. J Bacteriol. 2003 Mar.

Erratum in

  • J Bacteriol. 2003 May;185(9):2973

Abstract

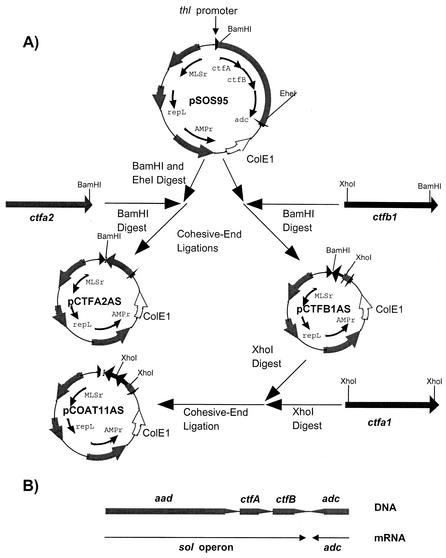
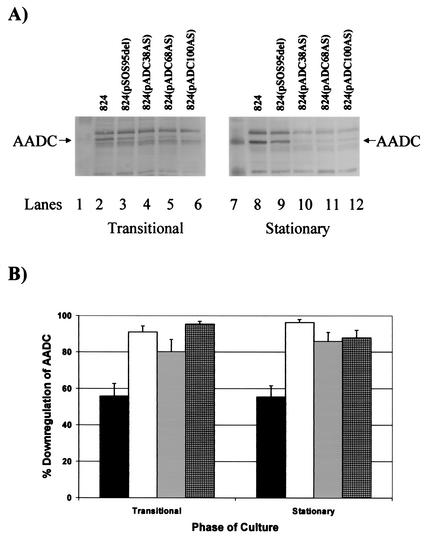
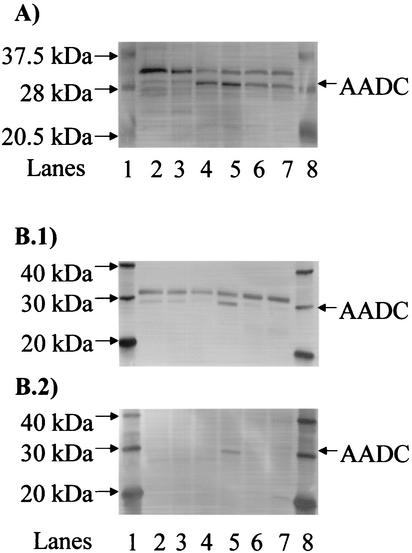
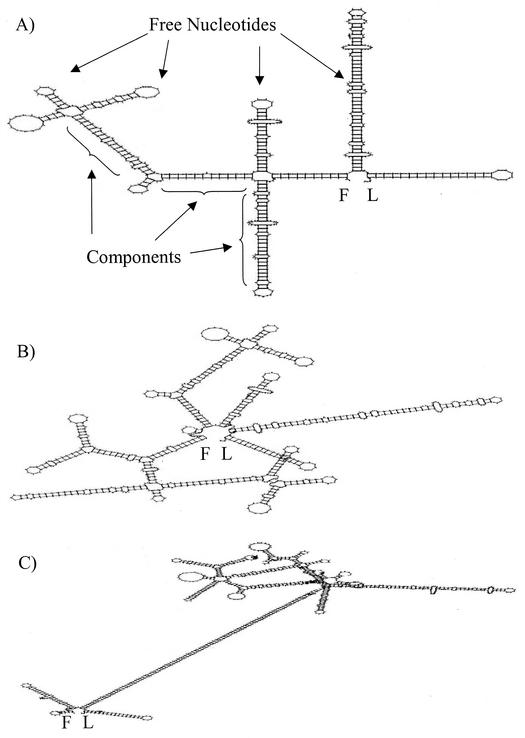
We investigated the effect of antisense RNA (asRNA) structural properties on the downregulation efficacy of enzymes in the acetone-formation pathway (acetoacetate decarboxylase [AADC] and coenzyme A-transferase [CoAT]) of Clostridium acetobutylicum strain ATCC 824. First, we generated three strains, C. acetobutylicum ATCC 824 (pADC38AS), 824(pADC68AS), and 824(pADC100AS), which contain plasmids that produce asRNAs of various lengths against the AADC (adc) transcript. Western analysis showed that all three strains exhibit low levels of AADC compared to the plasmid control [ATCC 824(pSOS95del)]. By using computational algorithms, the three different asRNAs directed toward AADC, along with previously reported clostridial asRNAs, were examined for structural features (free nucleotides and components). When the normalized metrics of these structural features were plotted against percent downregulation, only the component/nucleotide ratio correlated well with in vivo asRNA effectiveness. Despite the significant downregulation of AADC in these strains, there were no concomitant effects on acetone formation. These findings suggest that AADC does not limit acetone formation and, thus, we targeted next the CoAT. Using the component/nucleotide ratio as a selection parameter, we developed three strains [ATCC 824 (pCTFA2AS), 824(pCTFB1AS), and 824(pCOAT11AS)] which express asRNAs to downregulate either or both of the CoAT subunits. Compared to the plasmid control strain, these strains produced substantially low levels of acetone and butanol and Western blot analyses showed significantly low levels of both CoAT subunits. These results show that CoAT is the rate-limiting enzyme in acetone formation and strengthen the hypothesis that the component/nucleotide ratio is a predictive indicator of asRNA effectiveness.


Figures

FIG. 1.
FIG. 1.
Construction of plasmids that express asRNA directed toward the downregulation of CoAT. (A) Construction of pCTFA2AS, pCTFB1AS, and pCOAT11AS. For each plasmid, the locations and directions of transcription of the relevant genes are indicated (arrows). Relevant restriction sites are shown. Abbreviations: thl promoter, promoter region for the thiolase gene of C. acetobutylicum strain ATCC 824; ctfA, CoAT subunit A gene; ctfB, CoAT subunit B gene; adc, AADC gene; MLSr, macrolide-lincosamide-streptogramin B resistance gene; repL, pIM13 origin of replication; AMPr, ampicillin resistance gene; ColE1, ColE1 origin of replication. All genes and plasmids are not drawn to scale. (B) Genetic organization of the sol operon. Abbreviations: aad, alcohol/aldehyde dehydrogenase structural gene; sol operon, polycistronic message that includes the mRNA for aad, ctfA, and ctfB. Lines with arrows represent the location and direction of each transcript.
FIG. 2.
FIG. 2.
Downregulation of AADC in C. acetobutylicum adc-asRNA-expressing strains. (A) AADC Western blots from the transitional and stationary phases of fermentation. AADC bands as well as the closest marker bands are indicated for both blots. The culture phase from which the samples on each blot were taken is indicated below each blot. Lanes: 1, kaleidoscope-prestained marker from Bio-Rad Laboratories; 2, ATCC 824; 3, ATCC 824(pSOS95del); 4, ATCC 824(pADC38AS); 5, 824(pADC68AS); 6, 824(pADC100AS); 7, biotinylated protein marker from the horseradish peroxidase protein marker detection pack from New England Biolabs; 8, ATCC 824; 9, ATCC 824(pSOS95del); 10, ATCC 824(pADC38AS); 11, ATCC 824(pADC68AS); 12, ATCC 824(pADC100AS). (B) Percent downregulation of AADC in C. acetobutylicum adc-asRNA-expressing strains. The percent downregulation was calculated as the percent decrease of AADC gel band intensity in ATCC 824(pSOS95del) (▪), ATCC 824(pADC38AS) (□), ATCC 824(pADC68AS) (igwidth>), and ATCC 824(pADC100AS) (igwidth>) compared to that of the parental strain at the same culture phase in Western blots. The standard error of measurement was calculated from two to four different blots.
FIG. 3.
FIG. 3.
Verification of the AADC band in Western blots. (A) Western blot with negative and positive controls for AADC expression. AADC and several of the closest marker bands (20.5, 28, and 37.5 kDa) are indicated. Lanes: 1 and 8, biotinylated protein marker from the horseradish peroxidase protein marker detection pack (New England Biolabs); 2, ATCC 824 at early exponential phase (2-liter bioreactor); 3, strain M5 at stationary phase (static-flask culture); 4, ATCC 824 at stationary phase (5-liter bioreactor); 5, ATCC 824 at transitional phase (5-liter bioreactor); 6, ATCC 824 at stationary phase (2-liter bioreactor); 7, ATCC 824 at transitional phase (2-liter bioreactor). (B) Improved detection of AADC in Western blots. (B.1) Western blot in which antibodies were added in the presence of blocking reagent. (B.2) Western blot in which the primary antibody was pretreated with crude extracts of strain M5 prior to incubation with the membrane. AADC and several of the closest marker bands (20, 30, and 40 kDa) are indicated. Lanes: 1 and 8, MagicMark Western protein standard Invitrogen; 2, ATCC 824(pADC100AS) at transitional phase; 3, ATCC 824(pADC68AS) at transitional phase; 4, ATCC 824(pADC38AS) at transitional phase; 5, ATCC 824(pSOS95del) at transitional phase; 6, strain M5 at stationary phase; 7, strain M5 at exponential phase.
FIG. 4.
FIG. 4.
Predicted secondary structures of adc-asRNA. (A) adc38-asRNA; (B) adc68-asRNA; (C) adc100-asRNA. Examples of free nucleotides and components are shown for the asRNA of panel A. The first and last nucleotides of each asRNA molecule are designated F and L, respectively.
FIG. 5.
FIG. 5.
Relationship between the component/nucleotide ratio and the percentage overall protein downregulation for asRNA in solventogenic clostridia. The different asRNA are represented by the following symbols: ▴, glna-asRNA; □, ptb-asRNA; ▪, buk-asRNA; •, adc38-asRNA; ○, adc68-asRNA; formula image
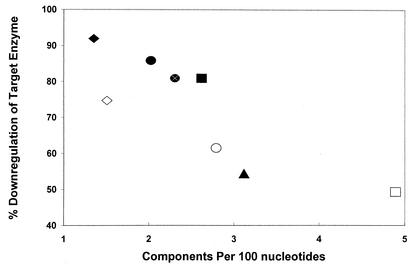
, adc100-asRNA; ♦, ctfb1-asRNA; (⋄), coat11-asRNA-b.
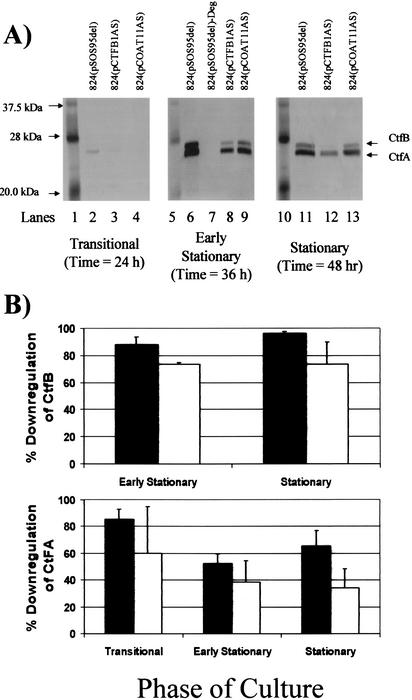
FIG. 6.
FIG. 6.
Downregulation of CtfA and CtfB subunits of CoAT by CoAT-asRNA. (A) CoAT Western blots from the transitional, early stationary, and stationary phases of C. acetobutylicum static-flask fermentations. The CtfA and CtfB subunits of CoAT as well as the closest marker bands are indicated for all blots. The culture phase from which the samples on each blot were taken are indicated below each blot. Lanes 1, 5, and 10, biotinylated protein marker from the horseradish peroxidase protein marker detection pack from New England Biolabs; lanes 2, 6, and 11, ATCC 824(pSOS95del); lanes 3, 8, and 12, ATCC 824(pCTFB1AS); lane 7, degenerate ATCC 824(pSOS95del); lanes 4, 9, and 13, ATCC 824(pCOAT11AS). (B) Percent downregulation of CtfA and CtfB subunits of CoAT by CoAT-asRNA. The percent downregulation of CtfA and CtfB in ATCC 824(pCTFB1AS) (▪) and 824(pCOAT11AS) (□) was calculated as the percent decrease of the desired gel band intensity of Western blots in the asRNA-expressing strain compared to that in the plasmid control strain [824(pSOS95del)] at the same culture phase. The standard error of measurement was calculated from two to four different blots.

References

    1. Berghammer, H., and B. Auer. 1993. “Easypreps”: fast and easy plasmid minipreparation for analysis of recombinant clones in E. coli. BioTechniques 14:524-528. - PubMed
    1. Buday, Z., J. C. Linden, and M. N. Karim. 1990. Improved acetone-butanol fermentation analysis using subambient HPLC column temperature. Enzyme Microb. Technol. 12:24-27.
    1. Cary, J. W., D. J. Petersen, E. T. Papoutsakis, and G. N. Bennett. 1990. Cloning and expression of Clostridium acetobutylicum ATCC 824 acetoacetyl-coenzyme A:acetate/butyrate:coenzyme A-transferase in Escherichia coli. Appl. Environ. Microbiol. 56:1576-1583. - PMC - PubMed
    1. Cornillot, E., R. V. Nair, E. T. Papoutsakis, and P. Soucaille. 1997. The genes for butanol and acetone formation in Clostridium acetobutylicum ATCC 824 reside on a large plasmid whose loss leads to degeneration of the strain. J. Bacteriol. 179:5442-5447. - PMC - PubMed
    1. Desai, R. P., and E. T. Papoutsakis. 1999. Antisense RNA strategies for the metabolic engineering of Clostridium acetobutylicum. Appl. Environ. Microbiol. 65:936-945. - PMC - PubMed

Publication types

LinkOut - more resources