

Identification of expressed genes linked to malignancy of human colorectal carcinoma by parametric clustering of quantitative expression data
- PMID: 12620106
- PMCID: PMC153461
- DOI: 10.1186/gb-2003-4-3-r21
Identification of expressed genes linked to malignancy of human colorectal carcinoma by parametric clustering of quantitative expression data
Abstract
Background: Individual human carcinomas have distinct biological and clinical properties: gene-expression profiling is expected to unveil the underlying molecular features. Particular interest has been focused on potential diagnostic and therapeutic applications. Solid tumors, such as colorectal carcinoma, present additional obstacles for experimental and data analysis.
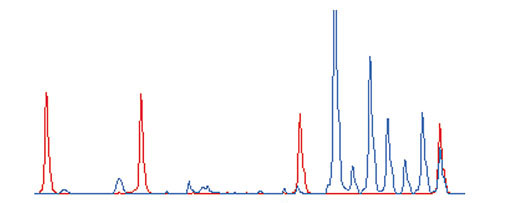
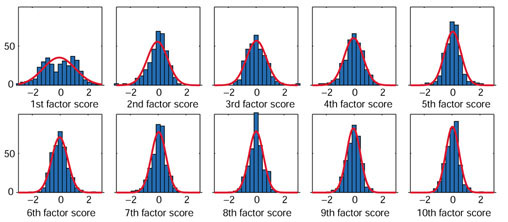
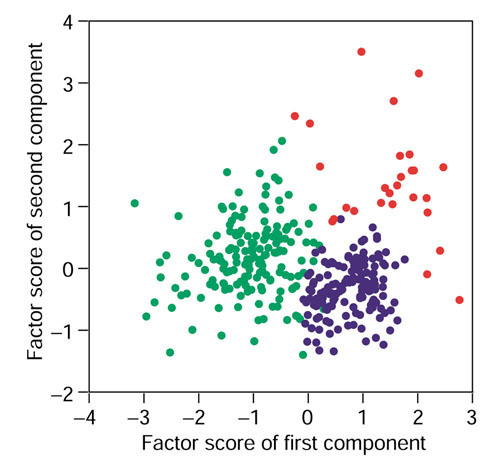
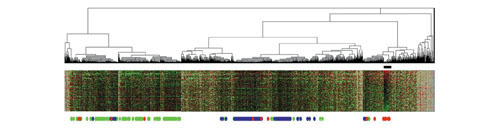
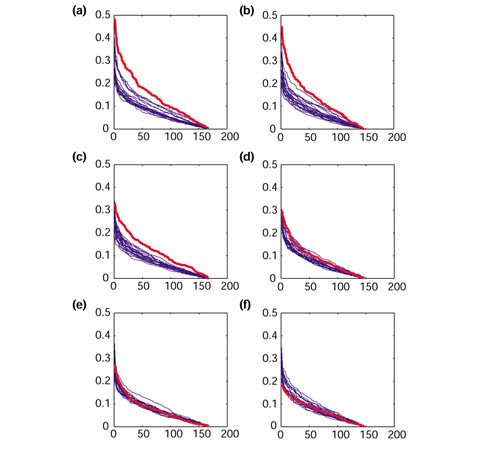
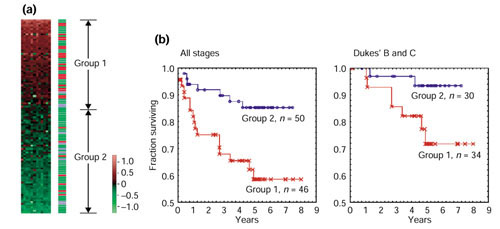
Results: We analyzed the expression levels of 1,536 genes in 100 colorectal cancer and 11 normal tissues using adaptor-tagged competitive PCR, a high-throughput reverse transcription-PCR technique. A parametric clustering method using the Gaussian mixture model and the Bayes inference revealed three groups of expressed genes. Two contained large numbers of genes. One of these groups correlated well with both the differences between tumor and normal tissues and the presence or absence of distant metastasis, whereas the other correlated only with the tumor/normal difference. The third group comprised a small number of genes. Approximately half showed an identical expression pattern, and cancer tissues were classified into two groups by their expression levels. The high-expression group had strong correlation with distant metastasis, and a poorer survival rate than the low-expression group, indicating possible clinical applications of these genes. In addition to c-yes, a homolog of a viral oncogene, prognostic indicators included genes specific to glial cells, which gives a new link between malignancy and ectopic gene expression.
Conclusions: The malignancy of human colorectal carcinoma is correlated with a unique expression pattern of a specific group of genes, allowing the classification of tumor tissues into two clinically distinct groups.
Figures
Similar articles
-
Iterative local Gaussian clustering for expressed genes identification linked to malignancy of human colorectal carcinoma.Bioinformation. 2007 Dec 30;2(5):175-81. doi: 10.6026/97320630002175. Bioinformation. 2007. PMID: 18305825 Free PMC article.
-
Introducing a novel and robust technique for determining lymph node status in colorectal cancer.Ann Surg. 2014 Jul;260(1):94-102. doi: 10.1097/SLA.0000000000000289. Ann Surg. 2014. PMID: 24169164
-
SPON2, a newly identified target gene of MACC1, drives colorectal cancer metastasis in mice and is prognostic for colorectal cancer patient survival.Oncogene. 2016 Nov 17;35(46):5942-5952. doi: 10.1038/onc.2015.451. Epub 2015 Dec 21. Oncogene. 2016. PMID: 26686083
-
MicroRNAs, ultraconserved genes and colorectal cancers.Int J Biochem Cell Biol. 2010 Aug;42(8):1291-7. doi: 10.1016/j.biocel.2009.05.018. Epub 2009 Jun 2. Int J Biochem Cell Biol. 2010. PMID: 19497386 Review.
-
Expression and genomic profiling of colorectal cancer.Biochim Biophys Acta. 2007 Jan;1775(1):103-37. doi: 10.1016/j.bbcan.2006.08.004. Epub 2006 Aug 22. Biochim Biophys Acta. 2007. PMID: 17010523 Review.
Cited by
-
Gene expression profiling of colorectal adenomas and early invasive carcinomas by cDNA array analysis.Br J Cancer. 2005 Apr 11;92(7):1193-200. doi: 10.1038/sj.bjc.6602442. Br J Cancer. 2005. PMID: 15785755 Free PMC article.
-
Microarray missing data imputation based on a set theoretic framework and biological knowledge.Nucleic Acids Res. 2006 Mar 20;34(5):1608-19. doi: 10.1093/nar/gkl047. Print 2006. Nucleic Acids Res. 2006. PMID: 16549873 Free PMC article.
-
Cancer gene expression database (CGED): a database for gene expression profiling with accompanying clinical information of human cancer tissues.Nucleic Acids Res. 2005 Jan 1;33(Database issue):D533-6. doi: 10.1093/nar/gki117. Nucleic Acids Res. 2005. PMID: 15608255 Free PMC article.
-
Cellular expression patterns of genes upregulated in murine and human colonic neoplasms.J Histochem Cytochem. 2008 May;56(5):433-41. doi: 10.1369/jhc.7A7359.2008. Epub 2008 Jan 7. J Histochem Cytochem. 2008. PMID: 18180384 Free PMC article.
-
Increases in c-Yes expression level and activity promote motility but not proliferation of human colorectal carcinoma cells.Neoplasia. 2007 Sep;9(9):745-54. doi: 10.1593/neo.07442. Neoplasia. 2007. PMID: 17898870 Free PMC article.
References
-
- Alizadeh AA, Eisen MB, Davis RE, Ma C, Lossos IS, Rosenwald A, Boldrick JC, Sabet H, Tran T, Yu X, et al. Distinct types of diffuse large B-cell lymphoma identified by gene expression profiling. Nature. 2000;403:503–511. - PubMed
-
- van't Veer LJ, Dai H, van de Vijver MJ, He YD, Hart AA, Mao M, Peterse HL, van der Kooy K, Marton MJ, Witteveen AT, et al. Gene expression profiling predicts clinical outcome of breast cancer. Nature. 2002;415:530–535. - PubMed
-
- Beer DG, Kardia SL, Huang CC, Giordano TJ, Levin AM, Misek DE, Lin L, Chen G, Gharib TG, Thomas DG, et al. Gene-expression profiles predict survival of patients with lung adenocarcinoma. Nat Med. 2002;8:816–824. - PubMed
-
- Fearon ER, Vogelstein B. A genetic model for colorectal tumorigenesis. Cell. 1990;61:759–767. - PubMed
Publication types
MeSH terms
LinkOut - more resources
Full Text Sources
Other Literature Sources
Medical
