Osprey: a network visualization system
- PMID: 12620107
- PMCID: PMC153462
- DOI: 10.1186/gb-2003-4-3-r22
Osprey: a network visualization system
Abstract
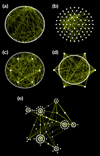
We have developed a software platform called Osprey for visualization and manipulation of complex interaction networks. Osprey builds data-rich graphical representations that are color-coded for gene function and experimental interaction data. Mouse-over functions allow rapid elaboration and organization of network diagrams in a spoke model format. User-defined large-scale datasets can be readily combined with Osprey for comparison of different methods.
Figures


References
-
- Vidal M. A biological atlas of functional maps. Cell. 2001;104:333–339. - PubMed
-
- Batagelj V, Mrvar A. Pajek - program for large network analysis. Connections. 1998;21:47–57.
-
- Sun Microsystems Java Standard Development Kit 1.4.0_02 http://java.sun.com
-
- The Grid http://biodata.mshri.on.ca/grid
-
- Batik SVG toolkit http://xml.apache.org/batik/
Publication types
MeSH terms
LinkOut - more resources
Full Text Sources
Other Literature Sources

