Comparative Study
. 2003 Feb 11:2:3.
doi: 10.1186/1475-925x-2-3.

Mechanomyography versus electromyography, in monitoring the muscular fatigue

Affiliations
Comparative Study

Mechanomyography versus electromyography, in monitoring the muscular fatigue

Mihai T Tarata. Biomed Eng Online. .

Abstract

Background: The use of the mechanomyogram (MMG) which detects muscular vibrations generated by fused individual fiber twitches has been refined. The study addresses a comparison of the MMG and surface electromyogram (SEMG) in monitoring muscle fatigue.

Methods: The SEMG and MMG were recorded simultaneously from the same territory of motor units in two muscles (Biceps, Brachioradialis) of the human (n = 18), during sustained contraction at 25 % MVC (maximal voluntary contraction).

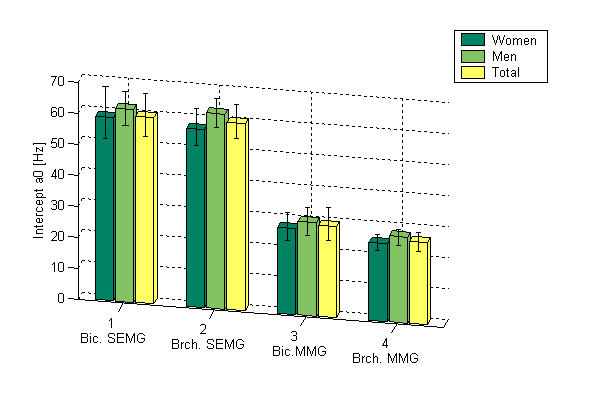
Results: The RMS (root mean square) of the SEMG and MMG increased with advancing fatigue; MF (median frequency) of the PSD (power density spectra) progressively decreased from the onset of the contraction. These findings (both muscles, all subjects), demonstrate both through the SEMG and MMG a central component of the fatigue. The MF regression slopes of MMG were closer to each other between men and women (Biceps 1.55%; Brachialis 13.2%) than were the SEMG MF slopes (Biceps 25.32%; Brachialis 17.72%), which shows a smaller inter-sex variability for the MMG vs. SEMG.

Conclusion: The study presents another quantitative comparison (MF, RMS) of MMG and SEMG, showing that MMG signal can be used for indication of the degree of muscle activation and for monitoring the muscle fatigue when the application of SEMG is not feasible (chronical implants, adverse environments contaminated by electrical noise).


Figures

Figure 1
Figure 1
Typical SEMG and MMG signals from the Biceps muscle (subject E). The figure shows SEMG (upper trace) and MMG (lower trace) signals, recorded from the same site of the Biceps muscle.
Figure 2
Figure 2
SEMG PSD evolution in time (subject E): Biceps muscle – surface plot. The figure shows the evolution in time of the Biceps muscle SEMG PSD. With increasing fatigue higher PSD peaks may be noticed.
Figure 3
Figure 3
SEMG PSD evolution in time (subject E): Biceps muscle – contour plot. The evolution in time of the Biceps muscle SEMG PSD is shown in contour plot, computed to display at 15 levels the isolines of the matrix containing the succession of the spectra, from the beginning to the end of the contraction (black – zero level; red, yellow – higher PSD peaks). The PSD compression towards lower frequency and higher PSD peaks by the end of contraction, are noticeable. The middle trace (blue) shows the SEMG MF evolution; MF decreases with increasing fatigue, thus proving the PSD compression. The lower trace (blue) shows the SEMG RMS evolution; RMS increases with increasing fatigue.
Figure 4
Figure 4
MMG PSD evolution in time (subject E): Biceps muscle. The figure shows the evolution in time of the Biceps muscle MMG PSD. With increasing fatigue higher PSD peaks may be noticed.
Figure 5
Figure 5
MMG PSD evolution in time (subject E): Biceps muscle. The evolution in time of the Biceps muscle MMG PSD is shown in contour plot, computed to display at 15 levels the isolines of the matrix containing the succession of the spectra, from the beginning to the end of the contraction (black – zero level; red, yellow – higher PSD peaks). The PSD compression towards lower frequency and higher PSD peaks by the end of contraction, are noticeable. The middle trace (blue) shows the MMG MF evolution; MF decreases with increasing fatigue, thus proving the PSD compression. The lower trace shows the MMG RMS evolution; RMS increases with increasing fatigue.
Figure 6
Figure 6
SEMG MF and MMG MF evolutions with increasing fatigue (subject E). MF evolutions are shown, both for the Biceps and Brachioradialis muscles (red – Biceps SEMG MF, blue – Brachioradialis SEMG MF, cian – Biceps MMG MF, green – Brachioradialis MMG MF). An overall decrease can be noticed starting at the very beginning of the contraction, which proves the central component of the fatigue.
Figure 7
Figure 7
SEMG RMS evolutions with increasing fatigue (subject E). SEMG RMS evolutions are shown, both for the Biceps (red) and Brachioradialis (blue) muscles. An overall increase can be noticed from the very beginning of the contraction, more pronounced as time elapses.
Figure 8
Figure 8
MMG RMS evolutions with increasing fatigue (subject E). MMG RMS evolutions are shown, both for the Biceps (cian) and Brachioradialis (green) muscles. An overall increase can be noticed from the very beginning of the contraction, more pronounced as time elapses.
Figure 9
Figure 9
Mean Slope (a1) of MF Evolution. The MF evolution mean slope (a1) is shown for the both muscles (Biceps & Brachioradialis) and for the both signals (SEMG and MMG) for the groups of Women, Men and Total (see legend). In all the cases the MF slope is negative (MF decreases in time), showing the compression of PSD toward lower frequencies. The standard deviations are shown.
Figure 10
Figure 10
Mean Intercept Point (a0) of MF Evolution. The MF evolution mean intercept point (a0) is shown for the both muscles (Biceps & Brachioradialis) and for the both signals (SEMG and MMG) for the groups of Women, Men and Total (see legend). It is comparable between men and women in all cases, for the SEMG and MMG. The standard deviations are shown.
Figure 11
Figure 11
Mean Slope (a1) of SEMG RMS Evolution. The SEMG RMS evolution mean slope (a1) is shown for the both muscles (Biceps & Brachioradialis) for the groups of Women, Men and Total (see legend). The standard deviations are shown.
Figure 12
Figure 12
Mean Intercept Point (a0) of SEMG RMS Evolution. The SEMG RMS evolution mean intercept point (a0) is shown for the both muscles (Biceps & Brachioradialis) and for the groups of Women, Men and Total (see legend). The standard deviations are shown.
Figure 13
Figure 13
Mean Slope (a1) of MMG RMS Evolution. The MMG RMS evolution mean slope (a1) is shown for the both muscles (Biceps & Brachioradialis) for the groups of Women, Men and Total (see legend). The standard deviations are shown.
Figure 14
Figure 14
Mean Intercept Point (a0) of MMG RMS Evolution. The MMG RMS evolution mean intercept point (a0) is shown for the both muscles (Biceps & Brachioradialis) and for the groups of Women, Men and Total (see legend). The standard deviations are shown.

References

    1. De Luca CJ. Control properties of motor units. J Exp Biol. 1985;115:125–136. - PubMed
    1. De Luca CJ, et al. Control Scheme Governing concurrently Active Human Motor Units During Voluntary Contractions. Journal of Physiology. 1982;329:129–142. - PMC - PubMed
    1. Tarata MT. Sensorimotor interactions within the context of muscle fatigue. "Sensorimotor Control" (Dengler R., Kossev A., eds.), NATO Science Series, Series 1: Life and Behavioural Sciences. 2001;326:84–91.
    1. Bigland-Ritchie B, Woods JJ. Changes in muscle contractile properties and neural control during human muscular fatigue. Muscle & Nerve. 1984;7:691–699. - PubMed
    1. Stulen FB, De Luca CJ. Frequency parameters of the myoelectric signal as a measure of muscle conduction velocity. IEEE Trans Biomed Eng. 1981;BME-28:515–522. - PubMed

LinkOut - more resources