Review
. 2003 Mar;67(1):86-156, table of contents.
doi: 10.1128/MMBR.67.1.86-156.2003.

Bacteriophage T4 genome

Affiliations
Review

Bacteriophage T4 genome

Eric S Miller et al. Microbiol Mol Biol Rev. 2003 Mar.

Abstract

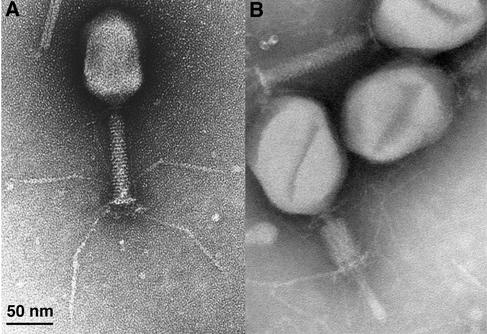
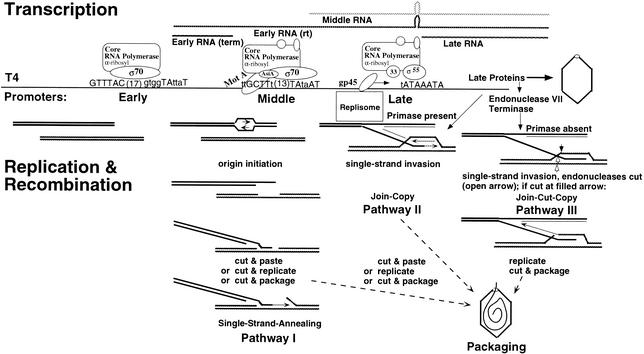
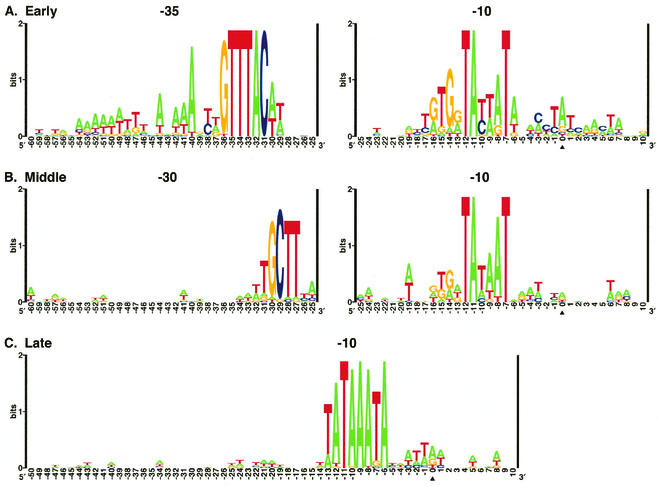
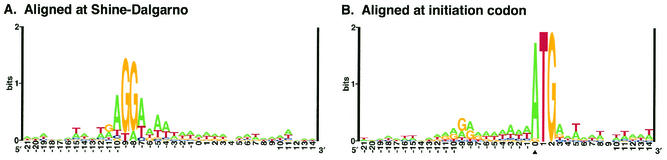
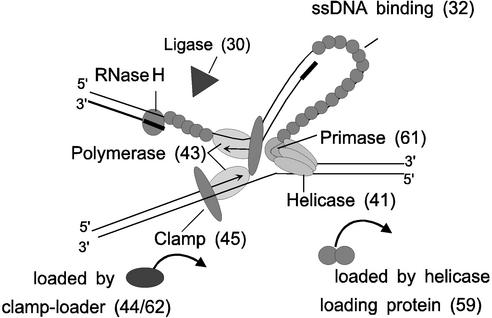
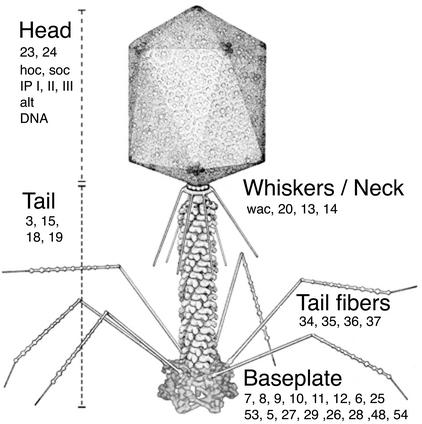
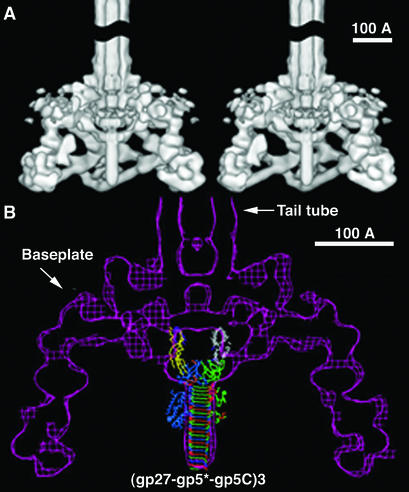
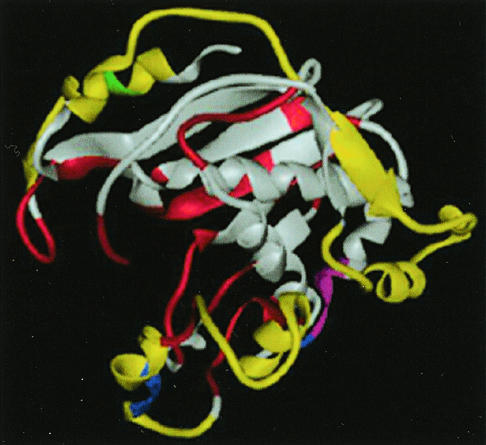
Phage T4 has provided countless contributions to the paradigms of genetics and biochemistry. Its complete genome sequence of 168,903 bp encodes about 300 gene products. T4 biology and its genomic sequence provide the best-understood model for modern functional genomics and proteomics. Variations on gene expression, including overlapping genes, internal translation initiation, spliced genes, translational bypassing, and RNA processing, alert us to the caveats of purely computational methods. The T4 transcriptional pattern reflects its dependence on the host RNA polymerase and the use of phage-encoded proteins that sequentially modify RNA polymerase; transcriptional activator proteins, a phage sigma factor, anti-sigma, and sigma decoy proteins also act to specify early, middle, and late promoter recognition. Posttranscriptional controls by T4 provide excellent systems for the study of RNA-dependent processes, particularly at the structural level. The redundancy of DNA replication and recombination systems of T4 reveals how phage and other genomes are stably replicated and repaired in different environments, providing insight into genome evolution and adaptations to new hosts and growth environments. Moreover, genomic sequence analysis has provided new insights into tail fiber variation, lysis, gene duplications, and membrane localization of proteins, while high-resolution structural determination of the "cell-puncturing device," combined with the three-dimensional image reconstruction of the baseplate, has revealed the mechanism of penetration during infection. Despite these advances, nearly 130 potential T4 genes remain uncharacterized. Current phage-sequencing initiatives are now revealing the similarities and differences among members of the T4 family, including those that infect bacteria other than Escherichia coli. T4 functional genomics will aid in the interpretation of these newly sequenced T4-related genomes and in broadening our understanding of the complex evolution and ecology of phages-the most abundant and among the most ancient biological entities on Earth.


Figures

FIG. 1.
FIG. 1.
Electron micrographs of bacteriophage T4. The well-recognized T4 morphology was nature's prototype of the NASA lunar excursion module. (A) Extended tail fibers recognize the bacterial envelope, and its prolate icosahedral head contains the 168,903-bp dsDNA genome. Reprinted with permission of M. Wurtz, Biozentrum, Basel, Switzerland. (B) The DNA genome is delivered into the host through the internal tail tube, which is visible protruding from the end of the contracted tail sheath. Courtesy of W. Rüger.
FIG. 2.
FIG. 2.
Intrastrand biases (nucleotide skew) in the T4 genome. (A) Cumulative values of the number of T's minus the number of A's in a contiguous strand of the T4 genome for the first (•), second (□), and third (○) codon positions and for the intergenic regions (+), plotted against the genome position. The plus strand was used (5′ to 3′), from position 0 clockwise through the genome map, for the calculation. (B) Cumulative values of C's minus G's plotted as described for panel A. (C) Vertical lines show the distribution of genes in each strand, where “Direct” is the plus strand for which the analysis was performed and “Complementary” is the minus strand. Reprinted from reference , with permission from the publisher.
FIG. 3.
FIG. 3.
Functional genome map of bacteriophage T4. The coding capacity of the T4 genome is shown for both characterized and hypothetical ORFs. The color scheme (by gene function) is as defined in Table 3. Origins of DNA replication (ori) indicated are those that are best characterized. Locations of the multiple promoters and terminators can be determined from Table 1.
FIG. 4.
FIG. 4.
Diagram of the relationship between the T4 transcriptional pattern and the different mechanisms of DNA replication and recombination. The top panel shows the transcripts initiated from early, middle, and late promoters by sequentially modified host RNA polymerase. Hairpins in several early and middle transcripts inhibit the translation of the late genes present on these mRNAs. The bottom panel depicts the pathways of DNA replication and recombination detailed later in this review. Hatched lines represent strands of homologous regions of DNA, and arrows point to positions of endonuclease cuts. Reprinted from reference with permission from the publisher.
FIG. 5.
FIG. 5.
Logo of T4 promoters. Nearly all the sequences in each alignment have promoter activity, as demonstrated by primer extension, transcription from cloned DNA fragments, or RNA hybridization assays. The promoters included whose start sites have not been mapped all precede a corresponding early, middle, or late gene and show significant similarity to the relevant promoter class. Sequences were independently aligned in the −10, −30, or −35 region. The information content (Rs) is calculated in “bits” and is the sum of the Rs for each region (except for the late logo, which was calculated from the single alignment at −10). Alignments, logos and Rs values were obtained as described previously (; E. Miller, T. Dean, and T. Schneider, unpublished data). The triangle marks the +1 transcription start site. (A) 39 early promoters, Rs = 38.3 bits; (B) 30 middle promoters, Rs = 21.1 bits; (C) 50 late promoters, Rs = 16.2 bits.
FIG. 6.
FIG. 6.
Logo of T4 RBS. Translation initiation regions of the annotated T4 GenBank file AF158101 were used; genes 25 and 38, which have extended spacing and RNA hairpins between the AUG and SD region, and gene 26′ were excluded. (A) Genes aligned at the initiator AUG or GUG codon. Information content analysis (Rs, in “bits”), from positions 0 to +14, yields an Rs = 7.5 bits. The variable spacing between the AUG and the SD region yields a reduced contribution of the SD region to the total Rs in the logo. This is seen by the low shoulder of purine-rich nucleotides in the logo from −11 to −6. (B) Genes aligned at the SD region. The region from −20 to −1 (relative to the 0 position in panel A) was independently aligned to achieve the highest Rs value in the SD region. In the region from −15 to −1, Rs = 6.8 bits. Over the entire RBS, spanning −15 to +14, the sum of Rs = 14.3 bits. Shultzaberger et al. (994) describe an alternative approach to modeling RBS Rs values that accounts for the variable spacing between the SD and initiator codon. Logos were created (Miller et al., unpublished) and alignments and Rs values were calculated as described previously (965, 966, 994).
FIG. 7.
FIG. 7.
The T4 replisome. A model of a T4 DNA replication fork and the central proteins is shown. Numbers indicate the gene encoding each protein. See the text for a description of the functions of each protein. Reprinted from reference with permission from the publisher.
FIG. 8.
FIG. 8.
Structural components of the T4 particle. Features of the particle have been resolved to about 3 nm. The positions of several head, tail, baseplate, and tail fiber proteins are indicated (see the text for details and references). Adapted and reprinted from reference with permission from the American Society for Microbiology, with baseplate modifications introduced by Petr Leiman (M. Rossmann laboratory, Purdue University).
FIG. 9.
FIG. 9.
Three-dimensional image reconstruction of the T4 tube-baseplate from cryoelectron microscopy. (A) Stereo image view of the baseplate and part of the tube at 17 Å resolution. The top quarter of the baseplate has been removed to show the internal features. Note the presence of the needle-like stick at the center of the baseplate beneath the tube. The arrangement of the six short tail fibers is also clearly visible. (B) Cross-section of the reconstituted baseplate into which the atomic structure of the (gp27-gp5∗-gp5C)3 complex solved by X-ray crystallography at 2.9 Å resolution is fitted. The conspicuous three-stranded β-helix, the C-terminal domain of gp5 or gp5C, with a length of 110 Å, precisely fits into the needle-like stick. gp27 constitutes the “cup” on top of the needle. The three gp5 monomers are colored red, green, and blue. The contour map of the baseplate is in purple. Reprinted from reference with permission from the publisher.
FIG. 10.
FIG. 10.
Structure of T4 thymidylate synthase. The T4 sequence was aligned with other available thymidylate synthases, with the invariant regions colored in red and the regions in which the T4 enzyme is different from all others colored in yellow. The latter regions are largely hydrophilic for most thymidylate synthases but are hydrophobic for the T4 enzyme (which may facilitate its incorporation into the nucleotide-synthesizing complex). These regions were not included for the predicted evolutionary tree in Fig. 11. Structural coordinates are from reference and were used to create this figure. Also see reference .
FIG. 11.
FIG. 11.
Phylogenetic tree of thymidylate synthases and deoxynucleotide hydroxymethylases. All protein sequences were obtained from the public databases. Alignment and tree construction were done by the methods of Feng and Doolittle (271).

References

    1. Abdus Sattar, A. K., T. C. Lin, C. Jones, and W. H. Konigsberg. 1996. Functional consequences and exonuclease kinetic parameters of point mutations in bacteriophage T4 DNA polymerase. Biochemistry 35:16621-16629. - PubMed
    1. Abedon, S. T. 1999. Bacteriophage T4 resistance to lysis-inhibition collapse. Genet. Res. 74:1-11. - PubMed
    1. Abedon, S. T. 1994. Lysis and the interaction between free phages and infected cells., p. 397-405. In J. Karam, J. W. Drake, K. N. Kreuzer, G. Mosig, D. H. Hall, F. A. Eiserling, L. W. Black, E. K. Spicer, E. Kutter, K. Carlson, and E. S. Miller (ed.), Molecular biology of bacteriophage T4. American Society for Microbiology, Washington, D.C.
    1. Abedon, S. T. 1990. Selection for lysis inhibition in bacteriophage. J. Theor. Biol. 146:501-511. - PubMed
    1. Abedon, S. T., T. D. Herschler, and D. Stopar. 2001. Bacteriophage latent-period evolution as a response to resource availability. Appl. Environ. Microbiol. 67:4233-4241. - PMC - PubMed

Publication types

LinkOut - more resources