. 2003 Mar 15;31(6):1753-64.
doi: 10.1093/nar/gkg268.

Toucan: deciphering the cis-regulatory logic of coregulated genes

Affiliations

Toucan: deciphering the cis-regulatory logic of coregulated genes

Stein Aerts et al. Nucleic Acids Res. .

Abstract

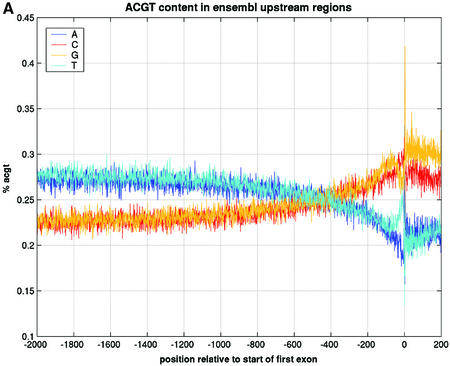
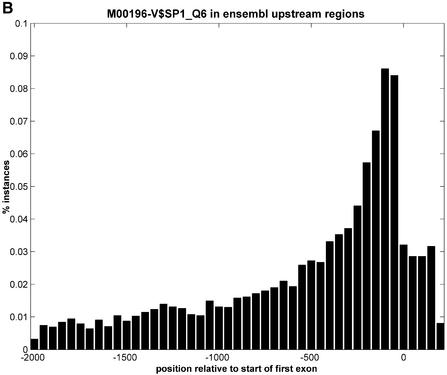
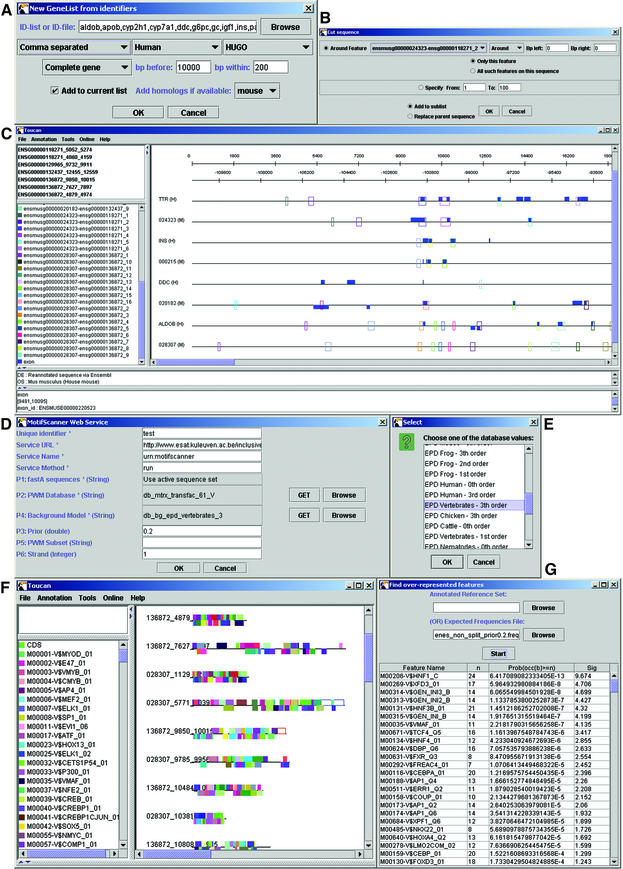
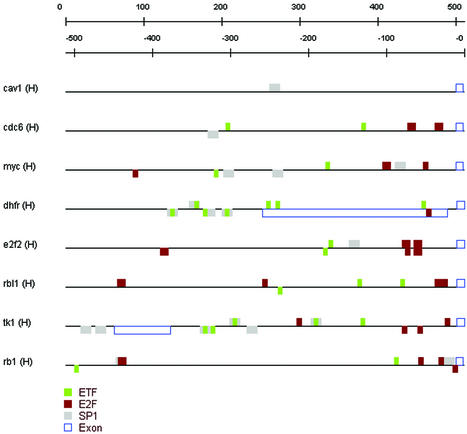
TOUCAN is a Java application for the rapid discovery of significant cis-regulatory elements from sets of coexpressed or coregulated genes. Biologists can automatically (i) retrieve genes and intergenic regions, (ii) identify putative regulatory regions, (iii) score sequences for known transcription factor binding sites, (iv) identify candidate motifs for unknown binding sites, and (v) detect those statistically over-represented sites that are characteristic for a gene set. Genes or intergenic regions are retrieved from Ensembl or EMBL, together with orthologs and supporting information. Orthologs are aligned and syntenic regions are selected as candidate regulatory regions. Putative sites for known transcription factors are detected using our MotifScanner, which scores position weight matrices using a probabilistic model. New motifs are detected using our MotifSampler based on Gibbs sampling. Binding sites characteristic for a gene set--and thus statistically over-represented with respect to a reference sequence set--are found using a binomial test. We have validated Toucan by analyzing muscle-specific genes, liver-specific genes and E2F target genes; we have easily detected many known binding sites within intergenic DNA and identified new biologically plausible sites for known and unknown transcription factors. Software available at http://www.esat.kuleuven.ac. be/ approximately dna/BioI/Software.html.


Figures

Figure 1
Figure 1
Representation of the genomic region 2000 bp upstream of Exon 1 annotation in Ensembl and 200 bp after the start of Exon 1, taken from 4000 randomly selected genes from the human genome (homo_sapiens_8_30a database at kaka.sanger.ac.uk). The relative position of 0 on the x-axis is the start of Exon 1. (A) Percentages of A, C, G and T at each position. (B) Number of instances of a SP1 binding site at each position.
Figure 1
Figure 1
Representation of the genomic region 2000 bp upstream of Exon 1 annotation in Ensembl and 200 bp after the start of Exon 1, taken from 4000 randomly selected genes from the human genome (homo_sapiens_8_30a database at kaka.sanger.ac.uk). The relative position of 0 on the x-axis is the start of Exon 1. (A) Percentages of A, C, G and T at each position. (B) Number of instances of a SP1 binding site at each position.
Figure 2
Figure 2
(Previous page) Screenshots of Toucan during the analysis of liver-specific genes. (A) Dialog where all gene names (HUGO symbols) are entered as a comma separated list. In the second drop-down box ‘Human’ is selected to search for and retrieve human genes. All organisms that are available in Ensembl (see http://www.ensembl.org) can be chosen from this list, and in the ‘Preferences’ menu the user can update these settings if Ensembl were to add new organisms. Depending on which organism is chosen, the third drop-down box shows all available external database identifiers that can be mapped to a stable Ensembl gene. The fourth drop-down box allows to choose between ‘complete gene’, ‘upstream of CDS’ and ‘upstream of Exon 1’. The latter corresponds in most cases to the region upstream of the TSS. The text boxes labeled with ‘bp before’ and ‘bp within’ state how many base pairs should be retrieved as flanking sequence upstream or around the specified region. In the last drop-down menu ‘mouse’ is selected to retrieve also the mouse orthologous sequences for each human gene in the list. (B) Every region that seems likely to contain putative regulatory modules (e.g., because it is conserved between species or because it contains a CpG island) can be selected and added to a sequence sublist. (C) Feature map. All open boxes represent regions that are at least 75% similar with their respective orthologous region, resulting from the AVID/VISTA web service. (D) Matrices, background model, and all other parameters are set in the dialog box of the MotifScanner. (E) Dialog showing the background models on our server. The values are retrieved transparently through the web service when the user presses the ‘GET’ button. (F) The results of the MotifScanner can either be saved or can be automatically added as features on the currently active sequence set. (G) Results of using the binomial formula to detect over-represented motifs. n is the number of occurrences of a binding site within this set, the third column is the p value for this motif, the fourth column the sig value (see Methods). The top scoring motifs for the human–mouse conserved regions in 10 kb upstream sequence of liver-specific genes are shown.
Figure 3
Figure 3
Promoter regions of eight E2F target genes with the over-represented TFBMs. The sequences were retrieved from Ensembl starting from a comma separated list of HUGO symbols and choosing ‘upstream of Exon 1’, 500 ‘bp before’ and 10 ‘bp within’.
Figure 4
Figure 4
Sequence logos (40) of a pair of similar motifs (see Table 2), one motif derived from the scoring matrix M00639 (HNF-6, upper logo) of the TRANSFAC database and one motif found by the MotifSampler (lower logo). The first is based on 13 binding sites in TRANSFAC, the second is based on 16 motif instances in our liver regulatory dataset. Positions 2–6 of the new motif match perfectly with the known motif. Position 1 of the new motif is certainly a T while the known motif has no information at that position.

References

    1. Lemon B. and Tjian,R. (2000) Orchestrated response: a symphony of transcription factors for gene control. Genes Dev., 14, 2551–2569. - PubMed
    1. Davidson E.H. (2001) Genomic Regulatory Systems. Development and Evolution. Academic Press, San Diego, CA.
    1. Hughes J.D., Estep,P.W., Tavazoie,S. and Church,G.M. (2000) Computational identification of cis-regulatory elements associated with groups of functionally related genes in Saccharomyces cerevisiae. J. Mol. Biol., 296, 1205–1214. - PubMed
    1. Thijs G., Marchal,K., Lescot,M., Rombouts,S., De Moor,B., Rouze,P. and Moreau,Y. (2002) A Gibbs sampling method to detect overrepresented motifs in the upstream regions of coexpressed genes. J. Comput. Biol., 9, 447–464. - PubMed
    1. Berman B.P., Nibu,Y., Pfeiffer,B.D., Tomancak,P., Celniker,S.E., Levine,M., Rubin,G.M. and Eisen,M.B. (2002) Exploiting transcription factor binding site clustering to identify cis-regulatory modules involved in pattern formation in the Drosophila genome. Proc. Natl Acad. Sci. USA, 99, 757–762. - PMC - PubMed

Publication types