. 2003 Mar 18;100(6):3293-8.
doi: 10.1073/pnas.0538075100. Epub 2003 Mar 7.

Transcriptional network controlled by the trithorax-group gene ash2 in Drosophila melanogaster

Affiliations

Transcriptional network controlled by the trithorax-group gene ash2 in Drosophila melanogaster

Sergi Beltran et al. Proc Natl Acad Sci U S A. .

Erratum in

  • Proc Natl Acad Sci U S A. 2012 Oct 16;109(42):17141

Abstract

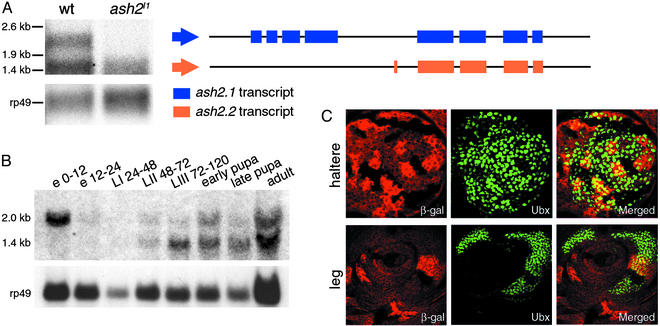
The transcription factor absent, small, or homeotic discs 2 (ash2) gene is a member of the trithorax group of positive regulators of homeotic genes. Mutant alleles for ash2 are larvalpupal lethals and display imaginal disc and brain abnormalities. The allele used in this study is a true mutant for the trithorax function and lacks the longest transcript present in wild-type flies. In an attempt to identify gene targets of ash2, we have performed an expression analysis by using cDNA microarrays. Genes involved in cell cycle, cell proliferation, and cell adhesion are among these targets, and some of them are validated by functional and expression studies. Even though trithorax proteins act by modulating chromatin structure at particular chromosomal locations, evidence of physical aggregation of ash2-regulated genes has not been found. This work represents the first microarray analysis, to our knowledge, of a trithorax-group gene.


Figures

Figure 1
Figure 1
(A–C) Molecular characterization of WT and mutant ash2 mRNA. (A) Northern blot analysis of poly(A) RNA extracted from WT and ash2I1 homozygous third instar larvae. Structure of the 2- (ash2.1) and 1.4-kb (ash2.2) transcripts after performing rapid amplification of cDNA ends is shown. (B) Developmental Northern blot of ash2 expression. In A and B, rp49 was used as a loading control. e, embryo; L, larval stages; numbering indicates hours after egg laying. (C) Down-regulation of UBX protein accumulation in ash2I1 mutant clones generated in haltere and leg imaginal discs by FLP-FRT-induced mitotic recombination. (Left) Staining with anti-β-galactosidase antibody:WT cells (bright red), heterozygous cells (red), and homozygous ash2I1 mutant cells (lack of red staining). (Center) Staining with anti-UBX antibody (green). (Right) Merged images.
Figure 2
Figure 2
Validation of the microarray analysis by RT-PCR of WT (+) and ash2I1 (−) mRNA samples on selected genes. Punch (Pu) and Cyclin A (CycA) are down-regulated genes; ribosomal protein rp49 and the endopeptidase tolkin (tok) are unaltered genes; Dodeca-satellite-binding protein 1 (Dp1) and thiredoxin peroxidase1 (Jafrac1) are up-regulated genes.
Figure 3
Figure 3
Classification of regulated genes (up- and down-) according to GO (MF, level 1; CC, level 2; and BP, level 2) and comparison with the genes used for the study (SAM input set). To assess the statistical significance of differences between sets of genes, we have calculated pairwise Chi2. Chi2 P values are given in the following order for each of the classes: SAM input vs. whole fly, overexpressed vs. SAM input and underexpressed vs. SAM input. The P values are as follows: MF1, 0.820, 0.008, and 0.006; BP2, 0.845, 0.000, and 0.000; and CC2, 0.931, 0.002, and 0.384.
Figure 4
Figure 4
Genes (rows) differentially expressed in the mutant ash2I1 clustered according to their MF level 1, and BP level 2 GO terms (columns). MF and BP descriptors are also clustered. A given gene has a GO term if the intersecting cell is dark gray (up-regulated) or light gray (down-regulated). Genes (CG nos. and BcDNAs) presenting only one GO term have been excluded. “Additional Information” has been extracted from FlyBase, interactive fly, and references herein. A POSTSCRIPT image with tree branches can be found at www.ub.es/epidd/arrays/index.htm.
Figure 5
Figure 5
ash2 has a role in regulating cell adhesion, development of neural system, and cell cycle. (A) Third instar larval brains from ash2I1/ash2I1 and WT individuals stained with anti-FASII. ol, optic lob; vg, ventral ganglion. Note the disruption of the neural pattern in both the optic lobe and the comissures of the ventral ganglion. (B) FLP-FRT clones on Minute (M) background of ash2I1 mutant cells from a wing imaginal disc tested for the up-regulated protein Fasciclin II (green). (C) Detail of a clone ash2I1/ash2I1 in the dorsal layer of cells of an adult wing (Left) and the same area (WT tissue) focused on the opposite wing side (Right). Note that in the WT condition each cell develops one hair, whereas in the dorsal mutant surface some cells develop multiple hairs (arrowheads). (D) Immunodetection of the down-regulated CycA (green) on M background FLP-FRT clones. (B and D Left) Staining with anti-β-galactosidase antibody in red (see Fig. 1 legend).

References

    1. Simon J. Curr Opin Cell Biol. 1995;7:376–385. - PubMed
    1. Schumacher A, Magnuson T. Trends Genet. 1997;13:167–170. - PubMed
    1. Kennison J A. Annu Rev Genet. 1995;29:289–303. - PubMed
    1. Mahmoudi T, Verrijzer C P. Oncogene. 2001;20:3055–3066. - PubMed
    1. Francis N J, Kingston R E. Nat Rev Mol Cell Biol. 2001;2:409–421. - PubMed

Publication types