. 2003 Mar 18;100(6):3107-12.
doi: 10.1073/pnas.0634629100. Epub 2003 Mar 7.

Protein pathway and complex clustering of correlated mRNA and protein expression analyses in Saccharomyces cerevisiae

Affiliations

Protein pathway and complex clustering of correlated mRNA and protein expression analyses in Saccharomyces cerevisiae

Michael P Washburn et al. Proc Natl Acad Sci U S A. .

Abstract

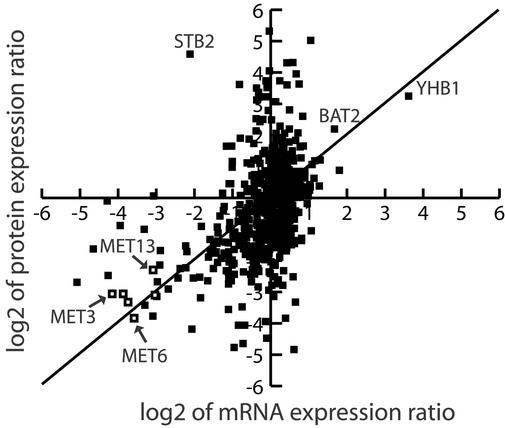
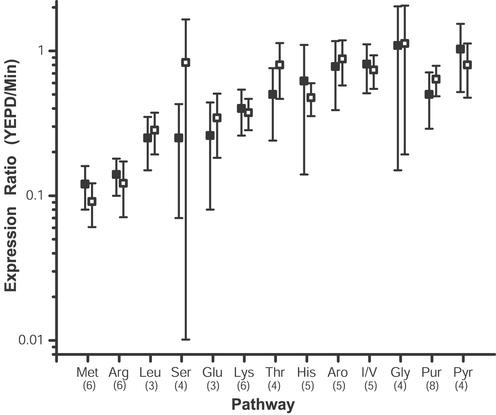
The mRNA and protein expression in Saccharomyces cerevisiae cultured in rich or minimal media was analyzed by oligonucleotide arrays and quantitative multidimensional protein identification technology. The overall correlation between mRNA and protein expression was weakly positive with a Spearman rank correlation coefficient of 0.45 for 678 loci. To place the data sets in a proper biological context, a clustering approach based on protein pathways and protein complexes was implemented. Protein expression levels were transcriptionally controlled for not only single loci but for entire protein pathways (e.g., Met, Arg, and Leu biosynthetic pathways). In contrast, the protein expression of loci in several protein complexes (e.g., SPT, COPI, and ribosome) was posttranscriptionally controlled. The coupling of the methods described provided insight into the biology of S. cerevisiae and a clustering strategy by which future studies should be based.


Figures

Figure 1
Figure 1
CAI distribution of identified mRNA and protein products from S. cerevisiae loci. (A) The 3,776 loci for which the mRNA had an intensity of at least 50 counts, as detected by Affymetrix oligonucleotide array analysis, are shown as a function of the CAI of the given loci. The soluble portion of the protein from each sample was analyzed by means of quantitative multidimensional protein identification technology as ratio mixtures of 14N or 15N proteins from cells grown in YEPD or minimal media. (B) The CAI distribution of the 688 loci for which the protein product was reproducibly detected, identified, and quantified from the YEPD vs. 15N minimal media sample, which was composed of a 1:1 mix of proteins from the soluble extract of cells grown in each of these media.
Figure 2
Figure 2
Scatter plot representation of the correlation between mRNA and protein expression ratios. The log2 value of the mRNA and protein ratios of expression in YEPD media vs. 15N minimal media for each locus was calculated and plotted for the 678 loci for which positive oligonucleotide array intensities and protein expression ratios were determined. A solid line is shown to represent the perfect positive correlation line. In addition, the open boxes shown indicate a grouping of each data point from loci in the methionine biosynthetic pathway from Table 3. The names of additional selected loci are also shown.
Figure 3
Figure 3
Correlation of mRNA and protein expression of amino acid and nucleotide biosynthetic pathway components. The mRNA and protein expression ratios of loci from each of the biosynthetic pathways shown were detected, identified, and quantified as described in Materials and Methods (Table 3). For each pathway that was represented in Table 3 by at least three loci, the average mRNA and protein expression ratio for the whole pathway was determined and plotted. The three-letter code for each pathway shown is of standard nomenclature except for that representing the biosynthetic pathways of the aromatic amino acids (Aro), the shared isoleucine/valine pathway (I/L), and the purine (Pur) and pyrimidine (Pyr) nucleotide biosynthetic pathways. The number in parentheses below each three-letter code represents the number of loci for which both the mRNA and protein expression was determined for the given pathway. The open boxes represent the average mRNA expression ratio of a given pathway, and the filled boxes represent the average protein expression ratio of a given pathway. The error bars represent one standard deviation of the data. Annotation of each identified loci was carried out by accessing the Yeast Proteome Database (15) and MIPS (16).
Figure 4
Figure 4
Alteration of protein expression of the RNA polymerase II transcriptional regulatory factors Tup1p, Anc1p, and Sin4p. (A) Data from one of the identifications of Tup1p, which was overexpressed in YEPD media by 8.4-fold as compared with minimal media in the combined data set, is shown. A 200-amu window around the MS elution profile for the 14N (M + 2H)2+ peptide VCFSPDGKFLATGAEDR from Tup1p is shown at m/z 935.8. The 15N (M + 2H)2+ version of this peptide from cells grown in 15N minimal media is barely visible at m/z 946.6. In addition, the 14N and 15N peak pair of an unidentified + 1 peptide is shown at m/z 988.3 and 996.3, respectively. (B) Data from one of the identifications of Anc1p, which was overexpressed in minimal media by 2.7-fold as compared with YEPD media in the combined data set, is shown. A 200-amu window around the MS elution profile for the 14N and 15N (M + 2H)2+ peptide VIYHLHPTFANPNR from Anc1p is shown at m/z 840.2 and 851.6, respectively. In addition, a portion of the elution profile of the 14N and 15N peak pair of a peptide from Rps2p is seen at m/z 943.8 and 956.7, respectively. (C) Data from one of the identifications of Sin4p, which was overexpressed in minimal media by 5-fold as compared with YEPD media in the combined data set, is shown. A 200 amu window around the MS elution profile for the 14N and 15N (M + 2H)2+ peptide FKNIIASPLSAGFNYGK from Sin4p is shown at m/z 914.0 and 924.3, respectively. In addition, portions of the elution profiles of the 14N and 15N peak pairs of two unique peptides from Pgk1p are seen at m/z 841.0/851.7 and 884.9/896.0, respectively.

References

    1. Lockhart D J, Winzeler E A. Nature. 2000;405:827–836. - PubMed
    1. McCarthy J E. Microbiol Mol Biol Rev. 1998;62:1492–1553. - PMC - PubMed
    1. Gygi S P, Rochon Y, Franza B R, Aebersold R. Mol Cell Biol. 1999;19:1720–1730. - PMC - PubMed
    1. Futcher B, Latter G I, Monardo P, McLaughlin C S, Garrels J I. Mol Cell Biol. 1999;19:7357–7368. - PMC - PubMed
    1. Ideker T, Thorsson V, Ranish J A, Christmas R, Buhler J, Eng J K, Bumgarner R, Goodlett D R, Aebersold R, Hood L. Science. 2001;292:929–934. - PubMed

MeSH terms

LinkOut - more resources