

Neuronal correlates of perception in early visual cortex
- PMID: 12627164
- PMCID: PMC2278238
- DOI: 10.1038/nn1024
Neuronal correlates of perception in early visual cortex
Abstract
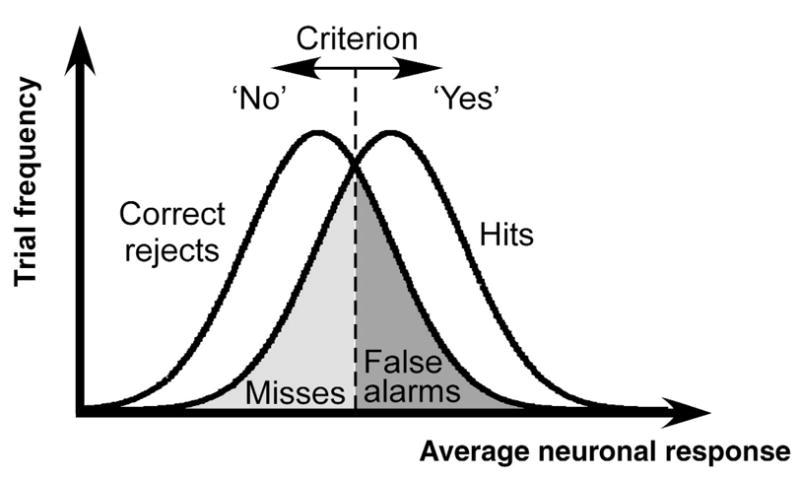
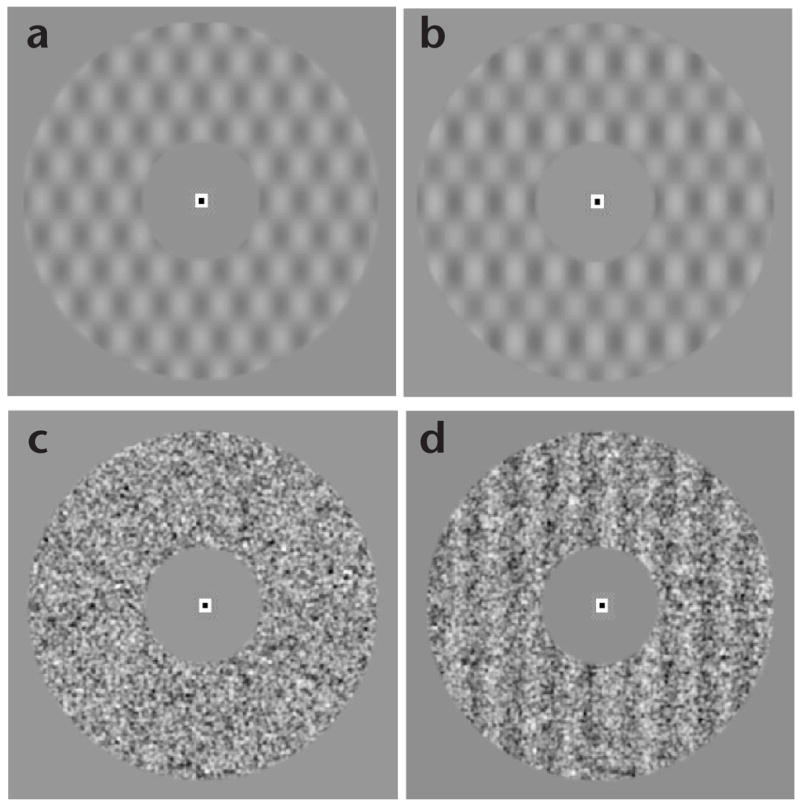
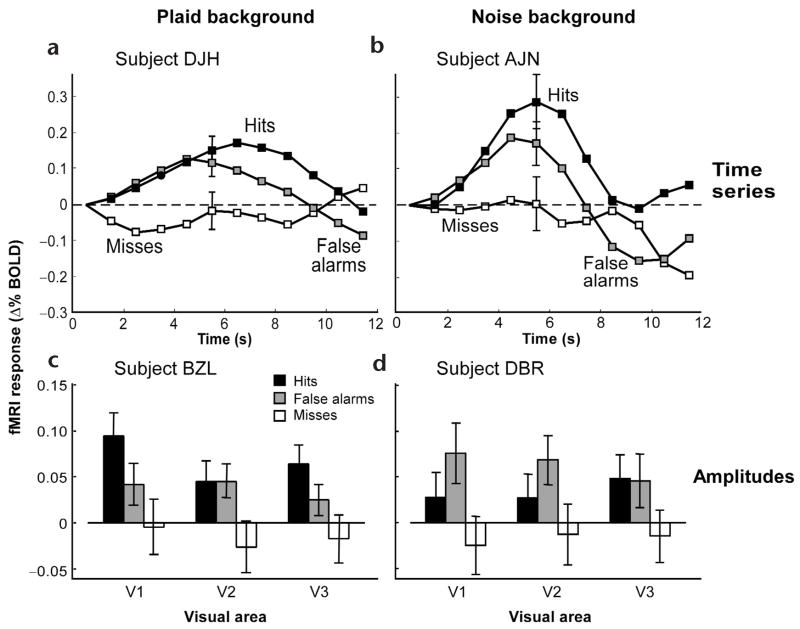
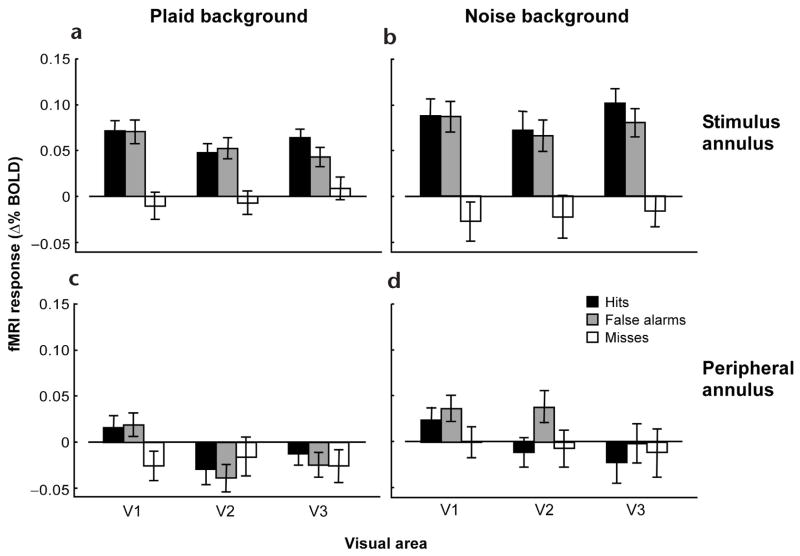
We used functional magnetic resonance imaging (fMRI) to measure activity in human early visual cortex (areas V1, V2 and V3) during a challenging contrast-detection task. Subjects attempted to detect the presence of slight contrast increments added to two kinds of background patterns. Behavioral responses were recorded so that the corresponding cortical activity could be grouped into the usual signal detection categories: hits, false alarms, misses and correct rejects. For both kinds of background patterns, the measured cortical activity was retinotopically specific. Hits and false alarms were associated with significantly more cortical activity than were correct rejects and misses. That false alarms evoked more activity than misses indicates that activity in early visual cortex corresponded to the subjects' percepts, rather than to the physically presented stimulus.
Figures
References
-
- Graham N. In: Visual Pattern Analyzers. Broadbent D, editor. Oxford Univ. Press; New York: 1989.
-
- Parker AJ, Newsome WT. Sense and the single neuron: probing the physiology of perception. Annu Rev Neurosci. 1998;21:227–277. - PubMed
-
- Geisler WS, Albrecht DG. Visual cortex neurons in monkeys and cats: detection, discrimination and identification. Vis Neurosci. 1997;14:897–919. - PubMed
-
- Dean AF. The variability of discharge of simple cells in the cat striate cortex. Exp Brain Res. 1981;44:437–440. - PubMed
Publication types
MeSH terms
Grants and funding
LinkOut - more resources
Full Text Sources
Other Literature Sources
