Comparative Study
. 2003 Mar 17;22(6):1398-409.
doi: 10.1093/emboj/cdg132.

The complex between a four-way DNA junction and T7 endonuclease I

Affiliations
Comparative Study

The complex between a four-way DNA junction and T7 endonuclease I

Anne-Cécile Déclais et al. EMBO J. .

Abstract

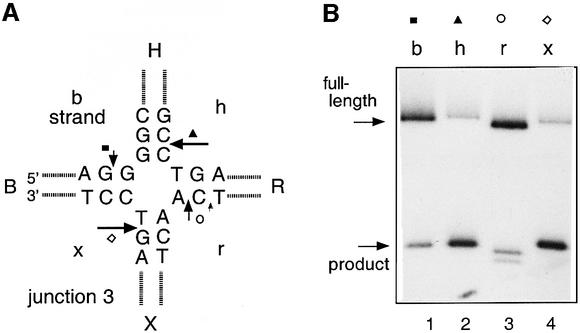
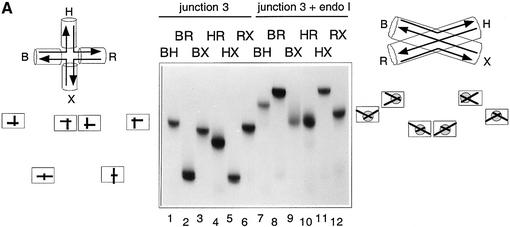
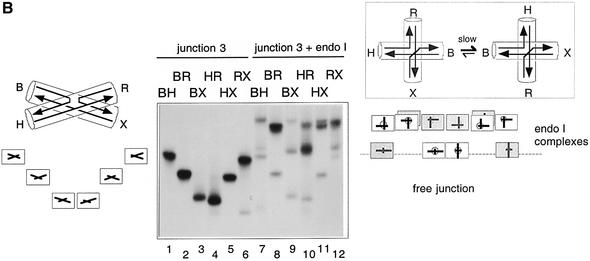
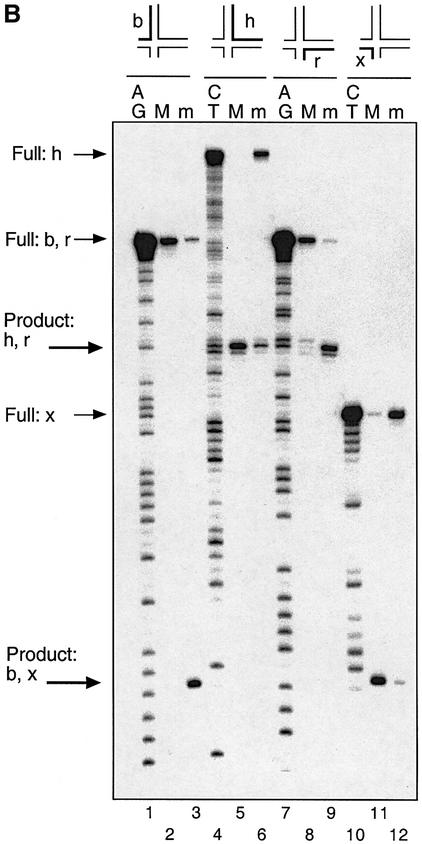
The junction-resolving enzyme endonuclease I is selective for the structure of the DNA four-way (Holliday) junction. The enzyme binds to a four-way junction in two possible orientations, with a 4:1 ratio, opening the DNA structure at the centre and changing the global structure into a 90 degrees cross of approximately coaxial helices. The nuclease cleaves the continuous strands of the junction in each orientation. Binding leads to pronounced regions of protection of the DNA against hydroxyl radical attack. Using all this information together with the known structure of the enzyme and the structure of the BglI-DNA complex, we have constructed a model of the complex of endonuclease I and a DNA junction. This shows how the enzyme is selective for the structure of a four-way junction, such that both continuous strands can be accommodated into the two active sites so that a productive resolution event is possible.


Figures

None
Fig. 1. Cleavage of a four-way DNA junction by endonuclease I. (A) The central sequence of junction 3 (Duckett et al., 1988) used for this analysis. The structural characteristics of this junction have been investigated extensively. For the analysis of cleavage, a version of this junction with arms of 15 bp was employed. The positions of cleavage (arrowed) have been deduced from electrophoresis on sequencing gels (e.g. Figure 3) and mass spectrometry (data not shown). (B) Junction 3 radioactively 5′-32P-labelled in a given strand was incubated with endonuclease I for 10 s at 20°C, and the substrate and products separated by electrophoresis in a 15% sequencing gel. The products were visualized by autoradiography. Tracks 1–4 contain DNA labelled on the b, h, r and x strands, respectively, after cleavage with endonuclease I. (C) Kinetics of cleavage of the different strands of junction 3. Plot of the fraction of cleavage (means of triplicate measurements; error bars are standard errors) for the individual strands as a function of time at 20°C. The data have been fitted to Equation 2 from which the rate constants have been calculated. Cleavage of b strand (filled squares), h strand (filled triangles), r strand (open circles) and x strand (open diamond).
None
Fig. 2. The global structure of the DNA junction complexed with endonuclease I analysed by comparative gel electrophoresis. Junction 3 was assembled in the six possible species with two long and two short arms. These were each incubated with endonuclease I, and analysed by electrophoresis in polyacrylamide. The arms of the junction are named in the same manner as previously (Figure 1); the long–short arm species are named according to the long arms, e.g. the BH species has long B and H arms, and short R and X arms. Parallel experiments were performed in which the electrophoretic mobility of the six species were examined in the absence of protein. (A) Analysis of the structure in the presence of EDTA. Under these conditions, the free junction (tracks 1–6) adopts the open-square conformation, giving rise to four slow species, with long arms subtending 90°, and two fast species where the long arms are co-linear. The interpretation of the pattern of mobilities is shown on the left. The endonuclease I–junction complexes (tracks 7–12) migrate as a series of discrete species, retarded with respect to the free junction. An interpretation of this pattern (see text for details) is given on the right. (B) Analysis of the structure in the presence of Ca2+. The free junction (tracks 1–6) adopts the stacked X-structure (shown left) based on B on X stacking, giving the slow–intermediate–fast–fast–intermediate–slow pattern of mobilities, interpreted on the left. This pattern can also be seen weakly in the species incubated with endonuclease I (tracks 7–12), indicating incomplete complex formation. The retarded species are complexes of the junction with endonuclease I, and are interpreted in terms of a slow exchange between two stacked forms indicated on the right (major form black, minor form grey). Each of these is based on a 90° cross, with different choices of stacking partners. This generates the pattern shown on the right as two superimposed sets of species.
None
Fig. 3. Identification of the strands cleaved in the two complexes formed in the presence of divalent metal ions. (A) Scheme showing the principle of the experiment. Endonuclease I is bound to a form of junction 3 with long H and R arms (in four versions, separately radioactively 5′-32P labelled on a single strand), and the two complexes separated by gel electrophoresis in the presence of Ca2+ ions (equivalent to Figure 2B, track 10). The two complexes for each junction are removed by slicing the gel, and the enzyme activated by addition of Mg2+ ions. The DNA is then recovered from the gel slices by electroelution, and analysed by sequencing gel electrophoresis. (B) Auto radiograph showing the analysis of strand cleavage in the two complexes. For each differently labelled junction, three tracks are shown containing a purine- (tracks 1 and 7) or pyrimidine-specific (tracks 4 and 10) sequence marker, the major (tracks 2, 5, 8 and 11) and minor (tracks 3, 6, 9 and 12) complexes for the junctions labelled on the b (tracks 1–3), h (tracks 4–6), r (tracks 7–9) and x (tracks 10–12) strands. The positions of the various full-length and product species are arrowed left.
None
Fig. 4. Local structural distortion of the junction studied by 2-AP fluorescence. Corrected fluorescence emission spectra (λex = 315 nm) were recorded as a function of the concentration of added endonuclease I. (A) The central sequences of junctions JAP3 and JAP5, used as the basis for these experiments. The chemical structure of 2-AP is shown inserted. For each of the junctions, there are three consecutive adenine nucleotides (highlighted bold) on the 3′ (JAP3) or 5′ (JAP5) side of the point of strand exchange. For the fluorescence experiments, one of these will have been replaced by 2-AP. For the data shown, the substitution has been made immediately at the point of strand exchange. In all cases, 50 nM solutions of DNA junctions have been used. (B) Fluorescence emission spectra of JAP3 with 2-AP located at the point of strand exchange, collected in solution in the absence of added metal ions, in the presence of 1 mM EDTA. The spectra are labelled with the stoichiometry of the protein. (C) Fluorescence emission spectra of JAP3, collected in solution in the presence of 200 µM Ca2+. The spectra are labelled with the stoichiometry of the protein. (D) Plot of normalized fluorescence intensity of JAP3 as a function of the stoichiometry of endonuclease in the presence of EDTA (triangles) or 200 µM Ca2+ (circles). (E) Plot of normalized fluorescence intensity of JAP5 as a function of the stoichiometry of endonuclease in the presence of EDTA (triangles) or 200 µM Ca2+ (circles).
None
Fig. 5. Opening of the junction by endonuclease I studied by permanganate probing. Junction Z28 was used for these experiments (central sequence shown in insert), radioactively 5′-32P-labelled on the r strand, which contains four thymine nucleotides on either side of the point of strand exchange. The junction in 200 µM CaCl2 was reacted with 1.25 mM permanganate in the presence of increasing quantities of bound endonuclease I. The DNA was then cleaved at the position of any cis-diol adducts by treatment with hot piperidine, and the products analysed by separation by denaturing gel electrophoresis and autoradiography. Lanes 1 and 2, Maxam–Gilbert (1980) sequencing reactions (purine-specific and pyrimidine-specific, respectively); lane 3, control incubation of the junction (100 nM) with 200 nM endonuclease I dimer in the absence of permanganate; lane 4, reaction of the junction with permanganate in the absence of endonuclease I; lanes 5–8, reaction of the junction with permanganate in the presence of 25, 50, 100 and 200 nM endonuclease I, respectively. The sequence of the r-strand of the junction is indicated down the right-hand side of the autoradiograph.
None
Fig. 6. Hydroxyl radical footprinting of endonuclease I on junction 3. (A) Four versions of junction 3 were prepared and radioactively 5′-32P-labelled on a unique strand. These were subjected to hydroxyl radical cleavage in the presence or absence of a stoichiometric quantity of endonuclease I. The products were separated by electrophoresis in a denaturing gel, and visualized by autoradiography. Phosphoimage files of similar gels were used for quantification. Lanes 1–4, 5–8, 9–12 and 13–16, junction labelled on b, h, r and x strands respectively; lanes 1, 5, 9 and 13, purine-specific sequencing reactions; lanes 2, 6, 10 and 14, pyrimidine-specific sequencing reactions; lanes 3, 7, 11 and 15, hydroxyl radical cleavage of junction 3 in the presence of endonuclease I; lanes 4, 8, 12 and 16, hydroxyl radical cleavage of free junction 3. (B) Radioactivity profiles of gel electrophoresis tracks from phosphoimages. These are shown for the four strands, where the left side is the 3′ end of the strand (corresponding to the top of the gel lane) in each case. The grey profiles are free junction, while the black profiles correspond to lanes in which junction–endonuclease I complexes were probed. The vertical bars denote the position of strand exchange on each strand. (C) Summary of the regions of greatest protection of the junction against hydroxyl radical attack. This shows the central sequence of the junction, with the protected region boxed. These correspond to >60% protection measured by quantification of radioactivity in individual bands.
None
Fig. 7. Molecular model of the structure of the endonuclease I–junction complex. (A and B) Two orthogonal views of the structure of the DNA junction in the complex, with the protein removed for clarity. The paths of the strands are highlighted by ribbons, and the four strands are differentiated by colour. Note that the global structure is in good agreement with that deduced from the comparative gel electrophoretic analysis; compare with Figure 2B. (C) Parallel-eye stereoscopic view of the structure of the complex. The protein is represented as a ribbon, with the two polypeptides differentiated by colour. The DNA strands are colour coded as in (A) and (B); note that the continuous strands are coloured yellow and red. The metal ions at the active sites are shown by space-filling in purple. The hydroxyl radical footprints (≥60% protection) are shown by the grey balls on the backbones. (D) Stereoscopic close-up view of the active site interacting with a continuous strand. The scissile phosphate is shown as a ball and stick, and the metal ions are shown by space-filling (yellow). The four active site residue side chains are indicated; those from one polypeptide (Asp55, Glu65 and Lys67) are blue, while Glu20 from the other polypeptide is green.

References

    1. Ariyoshi M., Vassylyev,D.G., Iwasaki,H., Nakamura,H., Shinagawa,H. and Morikawa,K. (1994) Atomic structure of the RuvC resolvase: a Holliday junction-specific endonuclease from E.coli. Cell, 78, 1063–1072. - PubMed
    1. Beaucage S.L. and Caruthers,M.H. (1981) Deoxynucleoside phosphor amidites—a new class of key intermediates for deoxypolynucleotide synthesis. Tetrahedron Lett., 22, 1859–1862.
    1. Bennett R.J. and West,S.C. (1995) Structural analysis of the RuvC–Holliday junction complex reveals an unfolded junction. J. Mol. Biol., 252, 213–226. - PubMed
    1. Bond C.S., Kvaratskhelia,M., Richard,D., White,M.F. and Hunter,W.N. (2001) Structure of Hjc, a Holliday junction resolvase, from Sulfolobus solfataricus. Proc. Natl Acad. Sci. USA, 98, 5509–5514. - PMC - PubMed
    1. Ceschini S., Keeley,A., McAlister,M.S.B., Oram,M., Phelan,J., Pearl,L.H., Tsaneva,I.R. and Barrett,T.E. (2001) Crystal structure of the fission yeast mitochondrial Holliday junction resolvase Ydc2. EMBO J., 20, 6601–6611. - PMC - PubMed

Publication types

MeSH terms