. 2003 Apr 1;100(7):3983-8.
doi: 10.1073/pnas.0530291100. Epub 2003 Mar 10.

Prospective identification of tumorigenic breast cancer cells

Affiliations

Prospective identification of tumorigenic breast cancer cells

Muhammad Al-Hajj et al. Proc Natl Acad Sci U S A. .

Erratum in

  • Proc Natl Acad Sci U S A. 2003 May 27;100(11):6890

Abstract

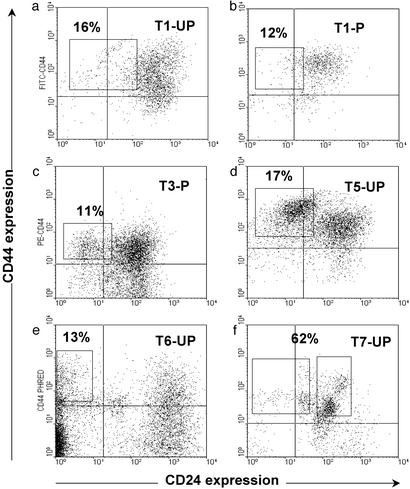
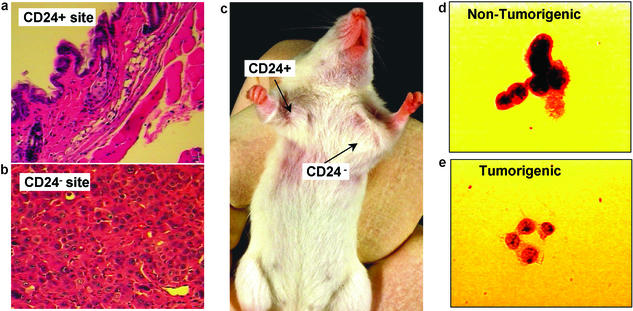
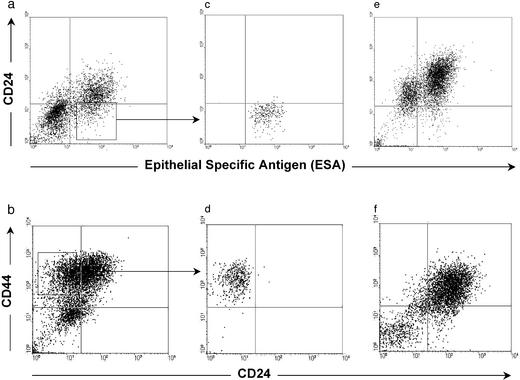
Breast cancer is the most common malignancy in United States women, accounting for >40,000 deaths each year. These breast tumors are comprised of phenotypically diverse populations of breast cancer cells. Using a model in which human breast cancer cells were grown in immunocompromised mice, we found that only a minority of breast cancer cells had the ability to form new tumors. We were able to distinguish the tumorigenic (tumor initiating) from the nontumorigenic cancer cells based on cell surface marker expression. We prospectively identified and isolated the tumorigenic cells as CD44(+)CD24(-/low)Lineage(-) in eight of nine patients. As few as 100 cells with this phenotype were able to form tumors in mice, whereas tens of thousands of cells with alternate phenotypes failed to form tumors. The tumorigenic subpopulation could be serially passaged: each time cells within this population generated new tumors containing additional CD44(+)CD24(-/low)Lineage(-) tumorigenic cells as well as the phenotypically diverse mixed populations of nontumorigenic cells present in the initial tumor. The ability to prospectively identify tumorigenic cancer cells will facilitate the elucidation of pathways that regulate their growth and survival. Furthermore, because these cells drive tumor development, strategies designed to target this population may lead to more effective therapies.


Figures

Figure 1
Figure 1
Isolation of tumorigenic cells. Flow cytometry was used to isolate subpopulations of T1 (a and b), T3 (c), T5 (d), T6 (e), and T7 (f) cells that were tested for tumorigenicity in NOD/SCID mice. T1 (b) and T3 (c) had been passaged (P) once in NOD/SCID mice, whereas the rest of the cells were frozen or unfrozen samples obtained directly after removal from a patient (UP). Cells were stained with antibodies against CD44, CD24, Lineage markers, and mouse-H2K (for passaged tumors obtained from mice), and 7AAD. Dead cells (7AAD+), mouse cells (H2K+), and Lineage+ normal cells were eliminated from all analyses. Each plot depicts the CD24 and CD44 staining patterns of live human Lineage cancer cells, and the frequency of the boxed tumorigenic cancer population as a percentage of cancer cells in each specimen is shown.
Figure 2
Figure 2
DNA content of tumorigenic and nontumorigenic breast cancer cells. The cell cycle status of the ESA+CD44+CD24−/lowLineage tumorigenic cells (a) and the remaining Lineage nontumorigenic cancer cells (b) isolated from T1 were determined by Hoechst 33342 staining of DNA content (20). The tumorigenic and nontumorigenic cell populations exhibited similar cell cycle distributions.
Figure 3
Figure 3
Histology from the CD24+ injection site (a; ×20 objective magnification) revealed only normal mouse tissue, whereas the CD24−/low injection site (b; ×40 objective magnification) contained malignant cells. (c) A representative tumor in a mouse at the CD44+CD24−/lowLineage injection site, but not at the CD44+CD24+Lineage injection site. T3 cells were stained with Papanicolaou stain and examined microscopically (×100 objective). Both the nontumorigenic (d) and tumorigenic (e) populations contained cells with a neoplastic appearance, with large nuclei and prominent nucleoli.
Figure 4
Figure 4
Phenotypic diversity in tumors arising from CD44+CD24−/lowLineage cells. The plots depict the CD24 and CD44 or ESA staining patterns of live human Lineage cancer cells from T1 (a, c, and e) or T2 (b, d, and f). T1 CD44+Lineage cells (a) or T2 Lineage cells (b) were obtained from tumors that had been passaged once in NOD/SCID mice. ESA+CD44+CD24−/lowLineage tumorigenic cells from T1 (c) or CD44+CD24−/lowLineage tumorigenic cells from T2 (d) were isolated and injected into the breasts of NOD/SCID mice; e and f depict analyses of the tumors that arose from these cells. In both cases, the tumorigenic cells formed tumors that contained phenotypically diverse cells similar to those observed in the original tumor.

Comment in

Similar articles

Cited by

References

    1. Stockler M, Wilcken N R, Ghersi D, Simes R J. Cancer Treat Rev. 2000;26:151–168. - PubMed
    1. Schultz L B, Weber B L. Curr Opin Oncol. 1999;11:429–434. - PubMed
    1. Aubele M, Werner M. Anal Cell Pathol. 1999;19:53–58. - PMC - PubMed
    1. Golub T R. N Engl J Med. 2001;344:601–602. - PubMed
    1. Heppner G H. Cancer Res. 1984;44:2259–2265. - PubMed

Publication types