Essential function of alpha-calcium/calmodulin-dependent protein kinase II in neurotransmitter release at a glutamatergic central synapse
- PMID: 12629219
- PMCID: PMC153083
- DOI: 10.1073/pnas.0530202100
Essential function of alpha-calcium/calmodulin-dependent protein kinase II in neurotransmitter release at a glutamatergic central synapse
Abstract
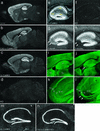
A significant fraction of the total calciumcalmodulin-dependent protein kinase II (CaMKII) activity in neurons is associated with synaptic connections and is present in nerve terminals, thus suggesting a role for CaMKII in neurotransmitter release. To determine whether CaMKII regulates neurotransmitter release, we generated and analyzed knockout mice in which the dominant alpha-isoform of CaMKII was specifically deleted from the presynaptic side of the CA3-CA1 hippocampal synapse. Conditional CA3 alpha-CaMKII knockout mice exhibited an unchanged basal probability of neurotransmitter release at CA3-CA1 synapses but showed a significant enhancement in the activity-dependent increase in probability of release during repetitive presynaptic stimulation, as was shown with the analysis of unitary synaptic currents. These data indicate that alpha-CaMKII serves as a negative activity-dependent regulator of neurotransmitter release at hippocampal synapses and maintains synapses in an optimal range of release probabilities necessary for normal synaptic operation.
Figures


Similar articles
-
CA1 long-term potentiation is diminished but present in hippocampal slices from alpha-CaMKII mutant mice.Learn Mem. 1998 Sep-Oct;5(4-5):344-54. Learn Mem. 1998. PMID: 10454359 Free PMC article.
-
Presynaptic long-term depression at a central glutamatergic synapse: a role for CaMKII.Nat Neurosci. 1998 Sep;1(5):378-83. doi: 10.1038/1589. Nat Neurosci. 1998. PMID: 10196527
-
The alpha-Ca2+/calmodulin kinase II: a bidirectional modulator of presynaptic plasticity.Neuron. 1995 Mar;14(3):591-7. doi: 10.1016/0896-6273(95)90315-1. Neuron. 1995. PMID: 7695905
-
[Study on the regulation of synaptic function by Ca2+/calmodulin-dependent protein kinase II].Yakugaku Zasshi. 2006 May;126(5):337-42. doi: 10.1248/yakushi.126.337. Yakugaku Zasshi. 2006. PMID: 16679741 Review. Japanese.
-
A fresh look at the role of CaMKII in hippocampal synaptic plasticity and memory.Bioessays. 2002 Mar;24(3):223-33. doi: 10.1002/bies.10057. Bioessays. 2002. PMID: 11891759 Review.
Cited by
-
Adaptive depression in synaptic transmission in the nucleus of the solitary tract after in vivo chronic intermittent hypoxia: evidence for homeostatic plasticity.J Neurosci. 2007 Apr 25;27(17):4663-73. doi: 10.1523/JNEUROSCI.4946-06.2007. J Neurosci. 2007. PMID: 17460079 Free PMC article.
-
Loss of Bmal1 impairs the glutamatergic light input to the SCN in mice.Front Cell Neurosci. 2025 Feb 27;19:1538985. doi: 10.3389/fncel.2025.1538985. eCollection 2025. Front Cell Neurosci. 2025. PMID: 40083633 Free PMC article.
-
Synaptic function is modulated by LRRK2 and glutamate release is increased in cortical neurons of G2019S LRRK2 knock-in mice.Front Cell Neurosci. 2014 Sep 26;8:301. doi: 10.3389/fncel.2014.00301. eCollection 2014. Front Cell Neurosci. 2014. PMID: 25309331 Free PMC article.
-
CaMKII Autophosphorylation Is Necessary for Optimal Integration of Ca2+ Signals during LTP Induction, but Not Maintenance.Neuron. 2017 May 17;94(4):800-808.e4. doi: 10.1016/j.neuron.2017.04.041. Neuron. 2017. PMID: 28521133 Free PMC article.
-
Transcriptome analysis of amoeboid and ramified microglia isolated from the corpus callosum of rat brain.BMC Neurosci. 2012 Jun 14;13:64. doi: 10.1186/1471-2202-13-64. BMC Neurosci. 2012. PMID: 22697290 Free PMC article.
References
-
- Cowan W M, Sudhof T C, Stevens C F, editors. Synapses. Baltimore: Johns Hopkins Univ. Press; 2001.
-
- Fernandez-Chacon R, Sudhof T C. Annu Rev Physiol. 1999;61:753–776. - PubMed
-
- Lisman J, Schulman H, Cline H. Nat Rev Neurosci. 2002;3:175–190. - PubMed
-
- Malinow R, Schulman H, Tsien R W. Science. 1989;245:862–866. - PubMed
-
- Silva A J, Stevens C F, Tonegawa S, Wang Y. Science. 1992;257:201–206. - PubMed
Publication types
MeSH terms
Substances
Grants and funding
LinkOut - more resources
Full Text Sources
Molecular Biology Databases
Research Materials
Miscellaneous

