. 2003 Mar;14(3):958-72.
doi: 10.1091/mbc.e02-07-0422.

Global transcription analysis of Krebs tricarboxylic acid cycle mutants reveals an alternating pattern of gene expression and effects on hypoxic and oxidative genes

Affiliations

Global transcription analysis of Krebs tricarboxylic acid cycle mutants reveals an alternating pattern of gene expression and effects on hypoxic and oxidative genes

Mark T McCammon et al. Mol Biol Cell. 2003 Mar.

Abstract

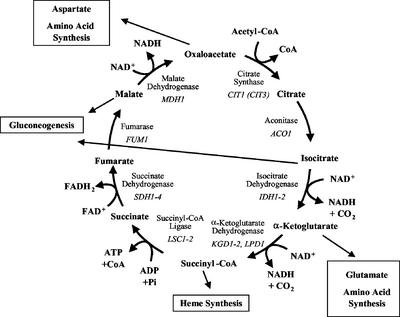
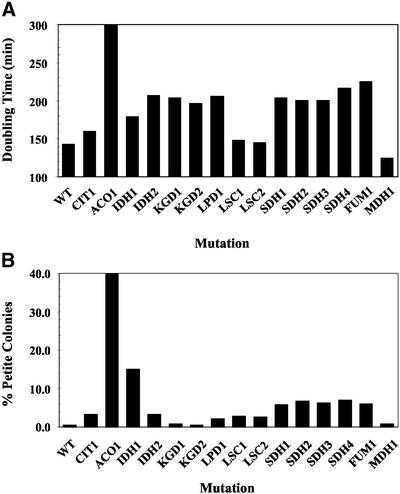
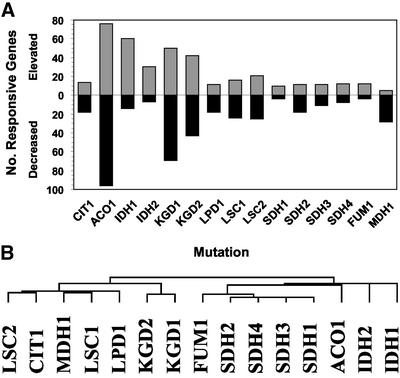
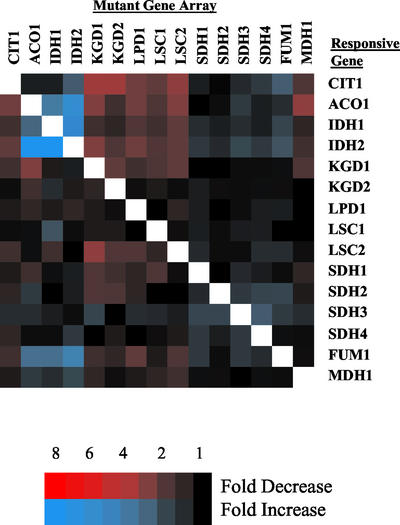
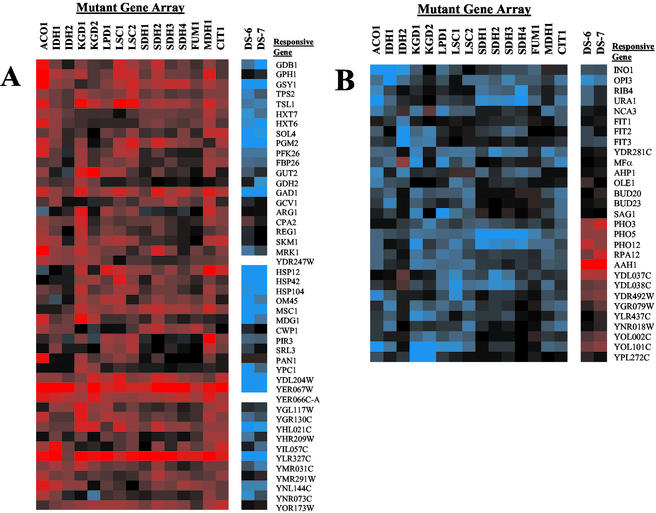
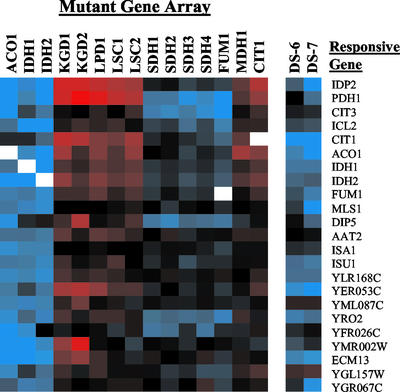
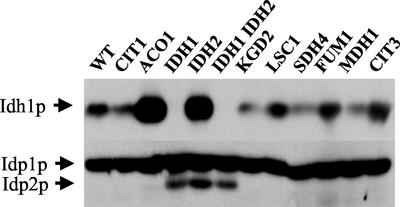
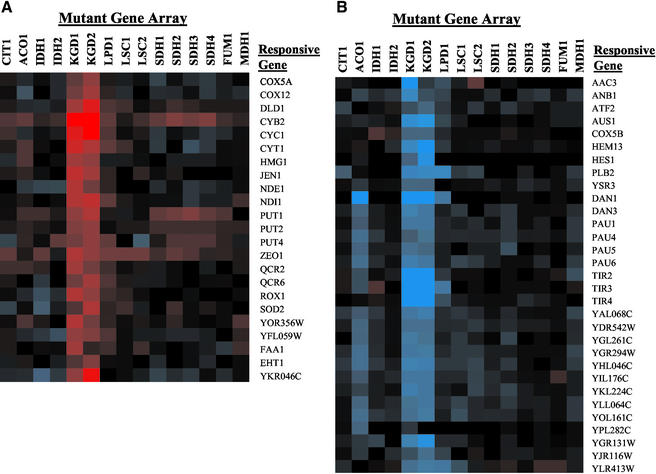
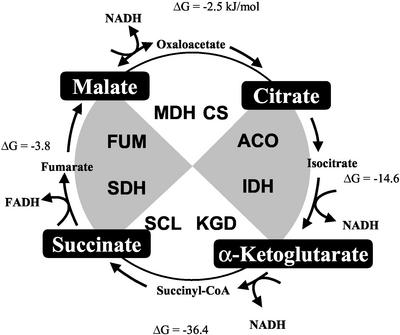
To understand the many roles of the Krebs tricarboxylic acid (TCA) cycle in cell function, we used DNA microarrays to examine gene expression in response to TCA cycle dysfunction. mRNA was analyzed from yeast strains harboring defects in each of 15 genes that encode subunits of the eight TCA cycle enzymes. The expression of >400 genes changed at least threefold in response to TCA cycle dysfunction. Many genes displayed a common response to TCA cycle dysfunction indicative of a shift away from oxidative metabolism. Another set of genes displayed a pairwise, alternating pattern of expression in response to contiguous TCA cycle enzyme defects: expression was elevated in aconitase and isocitrate dehydrogenase mutants, diminished in alpha-ketoglutarate dehydrogenase and succinyl-CoA ligase mutants, elevated again in succinate dehydrogenase and fumarase mutants, and diminished again in malate dehydrogenase and citrate synthase mutants. This pattern correlated with previously defined TCA cycle growth-enhancing mutations and suggested a novel metabolic signaling pathway monitoring TCA cycle function. Expression of hypoxic/anaerobic genes was elevated in alpha-ketoglutarate dehydrogenase mutants, whereas expression of oxidative genes was diminished, consistent with a heme signaling defect caused by inadequate levels of the heme precursor, succinyl-CoA. These studies have revealed extensive responses to changes in TCA cycle function and have uncovered new and unexpected metabolic networks that are wired into the TCA cycle.


Figures

Figure 1
Figure 1
The yeast TCA cycle. The eight enzymes of the TCA cycle are encoded by at least 15 nuclear genes in S. cerevisiae. Although CIT3 may encode an enzyme with citrate synthase activity, it may actually be a methylcitrate synthase and is not formally included as a TCA cycle gene. The TCA cycle contributes to gluconeogenesis in conjunction with the glyoxylate cycle, which is not active in higher animals.
Figure 2
Figure 2
Growth characteristics of TCA cycle mutants. (A) Doubling time of TCA cycle mutants in minutes in a rich medium with galactose as a carbon source. Values represent the average of at least two independent cultures. WT, wild-type strain. (B) Petite frequencies of TCA cycle mutants. Cultures were grown as described above and plated onto YPD plates at the time of harvest. After 3–4 d at 30°C, the percentage of small white colonies (i.e., petites) were counted. Values represent the average of at least two independent cultures for each mutation.
Figure 3
Figure 3
Genes responsive to TCA cycle dysfunction. Microarray analysis was performed in duplicate for each of the TCA cycle mutations, and the data were normalized and averaged as described in the MATERIALS AND METHODS section. Expression of 406 genes was altered threefold or greater by at least one TCA cycle mutation. (A) Summation of genes responding to TCA cycle gene dysfunction. The numbers of genes responding to each TCA cycle mutation are shown. Genes with elevated expression are shown by gray bars; genes with diminished expression are shown by black bars. Total responsive genes represent the sum of gray and black bars. (B) Clustering of TCA cycle mutant arrays. Array datasets for each TCA cycle mutation are clustered (Eisen et al., 1998). Similarities among arrays are indicated by the dendogram.
Figure 4
Figure 4
Expression of TCA cycle genes in TCA cycle mutant arrays. The expression of TCA cycle genes in each of the 15 sets of TCA mutant array sets are displayed relative to a wild-type strain with a complete TCA cycle. Results are visualized by TreeView program (Eisen et al., 1998). Missing or deleted data are displayed in white. The expression of individual TCA cycle genes in its own array (e.g., ACO1 gene expression in the ACO1 mutant array) was deleted and displayed in white in this and all subsequent array figures. Genes with an elevated expression are displayed in blue, and genes with decreased expression are displayed in red. Expression differences are indicated by the color intensity scale for this and subsequent figures.
Figure 5
Figure 5
Genes responsive to multiple TCA cycle defects. Common expression patterns in TCA cycle mutant strains grouped by pattern. For comparison, the last two time points from the diauxic shift microarray experiment of DeRisi et al. (1997) are also shown (DS-6 and DS-7). (A) Genes with decreased expression in TCA cycle mutants. (B) Genes with elevated expression in TCA cycle mutants.
Figure 6
Figure 6
Alternating expression of genes in response to different TCA cycle enzyme defects. Abrupt changes in gene expression are observed between defects in adjacent pairs of TCA cycle enzymes.
Figure 7
Figure 7
Expression pattern of Idh1p, Idp1p, and Idp2p in TCA cycle mutants. Strains harboring defects in TCA cycle genes were cultured in YPGal and analyzed as in the MATERIALS AND METHODS section. Protein levels of Idh1p, Idp1p, and Idp2p were detected by Western blotting.
Figure 8
Figure 8
CIT1 and YGR067c defects are growth enhancers of isocitrate dehydrogenase dysfunctional strains. Strains with the genotypes indicated were cultured overnight in YPD; an aliquot was washed once in water and resuspended to an initial concentration of 2 OD600/ml water. This was diluted in a 10-fold series, and 10 μl of each dilution was spotted onto a YPG plate that was incubated 4 d at 30°C. Larger colony sizes of Δcit1 Δidh2 and Δygr067c Δidh2 strains relative to Δidh2 strain indicate that the Δcit1 and Δygr067c are growth enhancers of Δidh2 defect (Gadde and McCammon, 1997; Przybyla-Zawislak et al., 1999). Growth of the wild-type and Δusv1 strains were indistinguishable from that of the Δygr067c strain.
Figure 9
Figure 9
Oxidative and hypoxic genes in α-ketoglutarate dehydrogenase and aconitase mutants. (A) Oxidative genes. (B) Hypoxic/anaerobic genes.
Figure 10
Figure 10
A sectored model of the TCA cycle to explain the alternating gene expression pattern in response to TCA cycle dysfunction. TCA cycle enzymes are paired on the basis of the alternating gene expression pattern in response to enzyme dysfunction. Enzyme defects in white resulted in decreased expression, and enzyme defects in gray resulted in elevated gene expression. ΔG values (kJ/mol) for each pair are calculated as the sum of the individual enzymes (Matthews et al., 2000). Potential signaling metabolites at the inflection points between these pairs are shown in black boxes. CS, citrate synthase; ACO, aconitase; IDH, isocitrate dehydrogenase; KGD, α-ketoglutarate dehydrogenase; SCL, succinyl-CoA ligase; SDH, succinate dehydrogenase; FUM, fumarase; MDH, malate dehydrogenase.

Similar articles

Cited by

References

    1. Anderson SL, Minard KI, McAlister-Henn L. Allosteric inhibition of NAD+-specific isocitrate dehydrogenase by a mitochondrial mRNA. Biochemistry. 2000;39:5623–5629. - PubMed
    1. Astuti D, et al. Gene mutations in the succinate dehydrogenase subunit SDHB cause susceptibility to familial pheochromocytoma and to familial paraganglioma. Am J Hum Genet. 2001;69:49–54. - PMC - PubMed
    1. Baysal BE, et al. Mutations in SDHD, a mitochondrial complex II gene, in hereditary paraganglioma. Science. 2000;287:848–851. - PubMed
    1. Bohm S, Frishman D, Mewes HW. Variations of the C2H2 zinc finger motif in the yeast genome and classification of yeast zinc finger proteins. Nucleic Acids Res. 1997;25:2464–2469. - PMC - PubMed
    1. Bojunga N, Entian K-D. Cat8p, the activator of gluconeogenic genes in Saccharomyces cerevisiae, regulates carbon source-dependent expression of NADP-dependent cytosolic isocitrate dehydrogenase (Idp2p) and lactate permease (Jen1p) Mol Gen Genet. 1999;262:869–785. - PubMed

Publication types

MeSH terms

LinkOut - more resources