. 2003 Mar;14(3):1002-16.
doi: 10.1091/mbc.e02-04-0244.

Specification of actin filament function and molecular composition by tropomyosin isoforms

Affiliations

Specification of actin filament function and molecular composition by tropomyosin isoforms

Nicole S Bryce et al. Mol Biol Cell. 2003 Mar.

Abstract

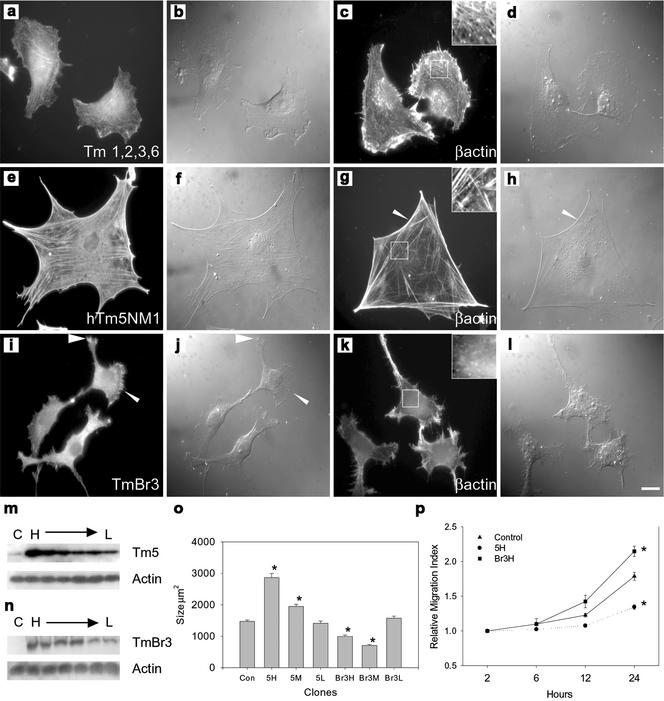
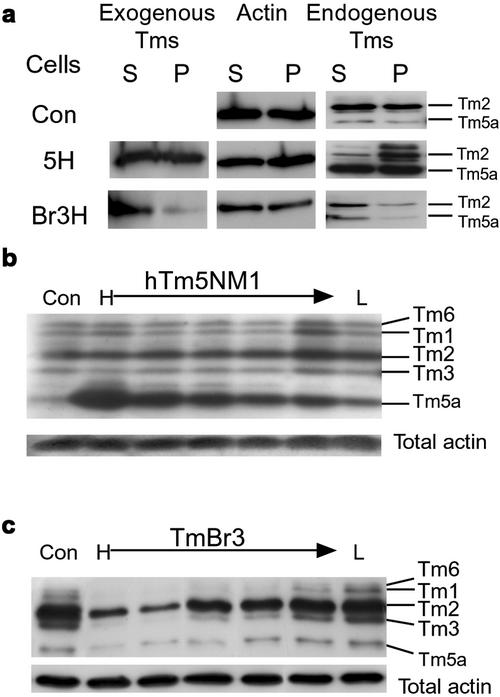
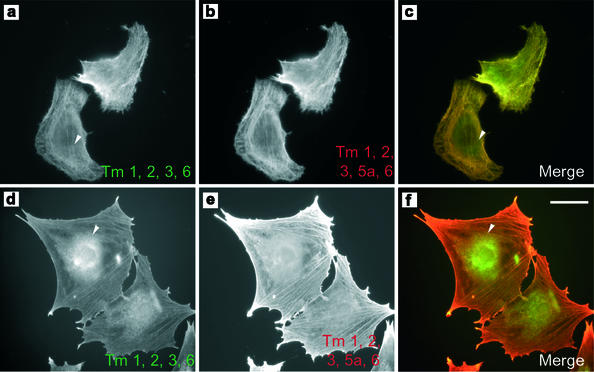
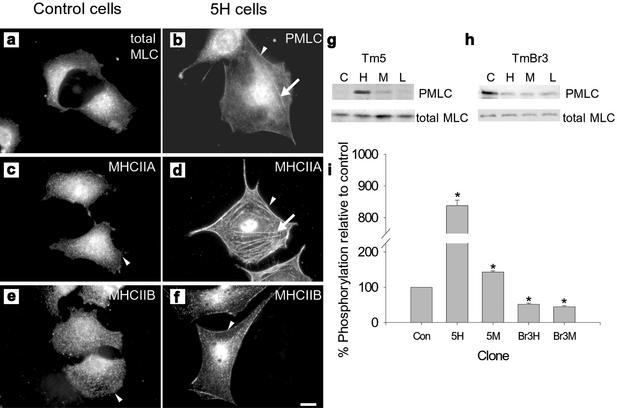
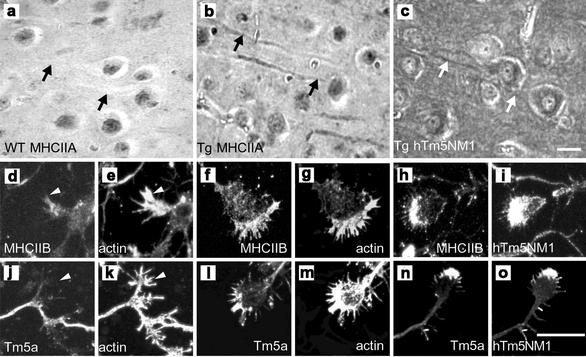
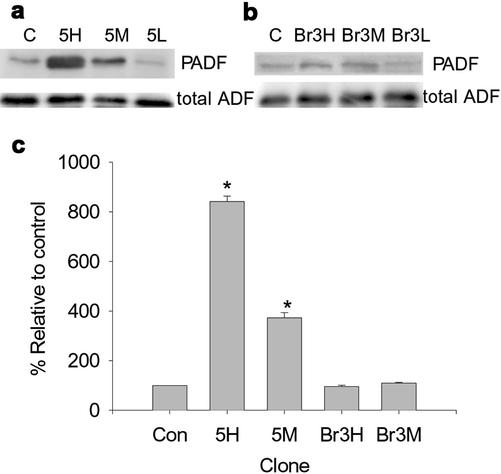
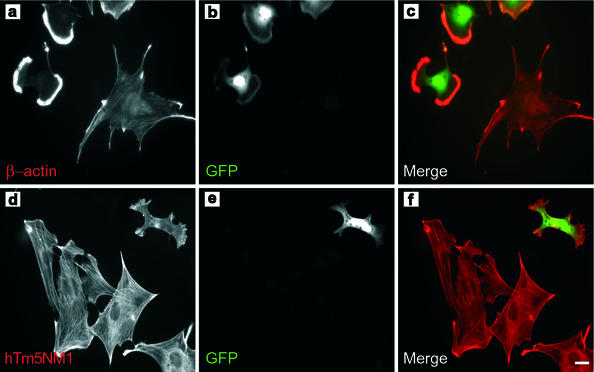
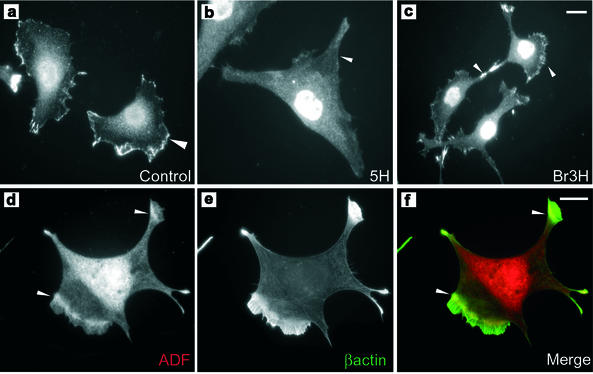
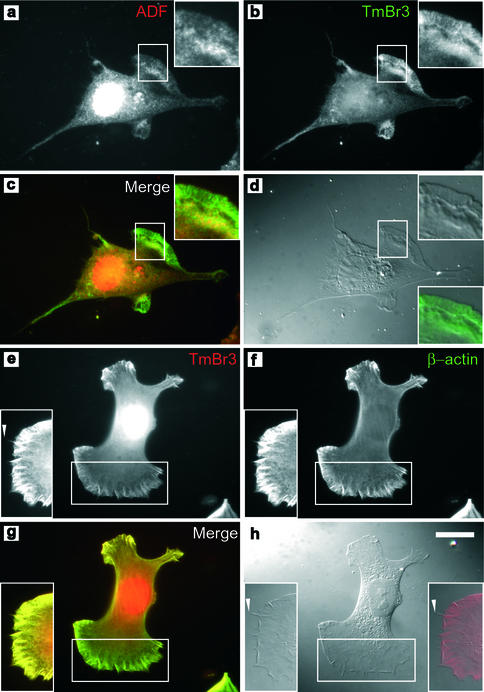
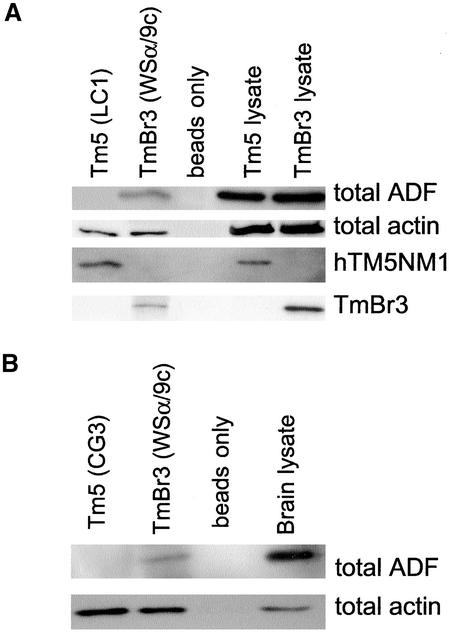
The specific functions of greater than 40 vertebrate nonmuscle tropomyosins (Tms) are poorly understood. In this article we have tested the ability of two Tm isoforms, TmBr3 and the human homologue of Tm5 (hTM5(NM1)), to regulate actin filament function. We found that these Tms can differentially alter actin filament organization, cell size, and shape. hTm5(NM1) was able to recruit myosin II into stress fibers, which resulted in decreased lamellipodia and cellular migration. In contrast, TmBr3 transfection induced lamellipodial formation, increased cellular migration, and reduced stress fibers. Based on coimmunoprecipitation and colocalization studies, TmBr3 appeared to be associated with actin-depolymerizing factor/cofilin (ADF)-bound actin filaments. Additionally, the Tms can specifically regulate the incorporation of other Tms into actin filaments, suggesting that selective dimerization may also be involved in the control of actin filament organization. We conclude that Tm isoforms can be used to specify the functional properties and molecular composition of actin filaments and that spatial segregation of isoforms may lead to localized specialization of actin filament function.


Figures

Figure 1
Figure 1
Tm isoforms impact on cellular morphology and the arrangement of the cytoskeleton. (a) Control B35 cells immunostained with Tm311 and β-actin (c) showing the presence of fine stress fibers (insert c). (e and g) hTm5NM1 transfectants immunostained with LC1 (which only detects transfected hTm5NM1) and β-actin, respectively. Large, well-organized stress fibers were seen throughout the cells (insert g); arrowhead indicates the arced membrane at the edge of the cell. (i and k) TmBr3 transfectants immunostained with WSα/9c (which detects only TmBr3 in these cells) and β-actin, respectively. Punctate, perinuclear localization of TmBr3 with accumulation in the cell periphery (arrowheads) was observed as well as a decrease in stress fibers (insert k). Corresponding differential interference contrast images are shown in panels b, d, f, h, j, and l. Scale bar 10 μm. m, Western blots of control cells (Con) and a range of high to low (H→L) expressing hTm5NM1 clones showing the increase in total Tm5 levels. Total actin levels remained unchanged. (n) Western blot of control cells and a range of high to low expressing TmBr3 clones showing the increase of TmBr3 levels in these clones; however, total actin levels remained unchanged. (o) Histogram showing the average surface areas of a range of high, moderate, and low expressing hTm5NM1 and TmBr3 clones compared with control cells. Cell area measurements were taken of 100 cells per clone. *p < 0.05. p, Graph showing the increase in relative migration index of the Br3H cells compared with the control B35 cells as well as the decrease in motility seen in the 5H cells. There were no differences seen in the number of cells over the 24-h period. *p < 0.05 n = 9 (measurements of each cell line at each time point).
Figure 2
Figure 2
Expression of exogenous Tm isoforms alters the biochemical properties and levels of endogenous Tm isoforms. (a) Triton extraction and ultracentrifugation of proteins from control cells, 5H and Br3H clones into triton soluble (S) and insoluble/pellet (P) fractions showed that the exogenous hTm5NM1 was detected evenly between the soluble and insoluble fractions, whereas the majority of the exogenous TmBr3 is in the triton-soluble fraction indicating that it is not associated with large stress fibers. Total actin was detected evenly between S and P for all cell types that demonstrates that there was no change in the soluble:pellet actin ratios. The overexpression of hTm5NM1 increased the amount of endogenous Tm isoforms in the P fraction compared with the control cells and TmBr3 cells, indicating that the endogenous Tm isoforms are associated preferentially with stress fibers and small filaments. (b) Increasing hTm5NM1 expression was associated with an increase in Tm5a expression. There was no change in the levels of HMW Tms (Tm6, 1, 2, and 3) and total actin levels remained unchanged. (c) TmBr3 overexpression results in decreased HMW Tm levels. Total actin levels remained unchanged.
Figure 3
Figure 3
hTm5NM1 can regulate the molecular composition of stress fibers. Control B35 cells were immunostained with TM311 to visualize the stress fibers containing the high molecular weight Tms 1, 2, 3, and 6. Arrowhead indicates the absence of perinuclear staining (a). The HMW Tms and Tm5a were detected using the WSα/9d antibody showing that Tm5a is also localized to stress fibers (b). (c) Merge of a (green) and b (red). (d) 5H immunostained with TM311. A subset of HMW Tms is localized in a punctate perinuclear manner (arrowhead). (e) Tm5a is localized predominantly to stress fibers in Tm5H cells as detected by the WSα/9d antibody. (f) Merged image of d (red) and e (green). Scale bar, 15 μm.
Figure 4
Figure 4
Tm isoforms can alter the activity and cellular localization of myosin II. Perinuclear localization of phosphorylated myosin light chain (PMLC) was observed in control cells (a), whereas in 5H (b) PMLC was localized to stress fibers (arrow) and the periphery of the cell (arrowhead). Myosin heavy chain IIA (MHCIIA) localization in control cells (c) was diffuse throughout the cytoplasm, but it was not present at the edge of the cell; however, in 5H (d) MHCIIA was localized to large stress fibers throughout the cell (arrow) as well as at the cells periphery (arrowhead). In control cells (e), myosin heavy chain IIB (MHCIIB) localization was punctate throughout the cytoplasm, whereas in 5H (f) there was an enrichment of MHCIIB at the cell periphery (arrowhead). Scale bar, 10 μm. (g) Western blots showing the levels of phosphorylated myosin light chain (PMLC) and total myosin in control (C), high (H), moderate (M), and low (L) expressing hTm5NM1 (g) and TmBr3 clones (h). These levels were quantified relative to control levels and shown in the histogram (i); *p < 0.05.
Figure 5
Figure 5
Overexpression of Tm isoforms in vivo results in altered actin organization and myosin localization. Ectopic expression of hTm5NM1 alters the spatial intracellular segregation of myosin isoforms IIA, IIB and Tm isoforms. Immunohistochemistry of 10 μm thin parasaggital sections of (a) wild-type and (b and c) hTm5NM1 transgenic adult mouse cortex, incubated with myosin IIA (a and b) and LC1 antibodies (c). Myosin IIA is present predominantly in the dendrites and cell bodies of hTm5NM1 overexpressing cortical neurons (b and c), respectively; see arrows. Arrows in a indicate the lack of myosin IIA in the dendrites and cell bodies of control cortical neurons. Scale bar, 10 μm. Confocal microscope images of immunofluorescence stained in vitro cultured 5-d-old primary cortical neuron growth cones. Control growth cones were double-immunostained with myosin IIB and actin (d and e) and WSα/9d and actin (l and k), respectively. hTm5NM1 overexpressing growth cones were double-immunostained with myosin IIB and actin (f and g), myosin IIB and LC1 (h and i), WSα/9d and actin (l and m), WSα/9d and LC1 (n and o), respectively. Myosin IIB is enriched in the growth cone periphery of hTm5NM1 over expressing cortical neurons (f and h), where the exogenous hTm5NM1 protein detected with the LC1 antibody is also present (i), this staining pattern is not obviously seen in control growth cones (d and e). Tropomyosin isoforms detected with the WSα/9d antibody were also found enriched in the growth cone periphery (i and k), where the exogenous hTm5NM1 is also present (o). In control growth cones the Tm isoforms detected with the WSα/9d antibody are highly diminished (j and k). Scale bar: (do), 10 μm.
Figure 6
Figure 6
Expression of hTm5NM1 but not TmBr3 alters the activity of actin depolymerizing factor. Western blots showing the levels of phosphorylated ADF/cofilin (PADF) and total ADF levels in control cells and high, moderate and low expressing hTm5NM1 (a) and TmBr3 clones (b). The graph (c) shows the quantification of PADF levels with respect to control levels. *p < 0.05.
Figure 7
Figure 7
Transient expression of TmBr3 can impact on the size of the cell and the arrangement of actin. 5H was transiently cotransfected with TmBr3 and GFP. (a) β-Actin immunostaining revealed that the cotransfected cells underwent drastic actin rearrangements with the loss of the large stress fibers seen in untransfected cells and the formation of β-actin rich lamellipodial regions. (b) GFP expression. (c) Merged image of a (red) and b (green). (d) Untransfected and transiently cotransfected 5H cells immunostained with LC1. hTM5NM1 stress fibers were not present in 5H cells cotransfected with TmBr3 and GFP. (e) GFP expression. (f) Merged image of d (red) and e (green). Scale bar, 10 μm.
Figure 8
Figure 8
The molecular composition of the actin microfilament alters the localization of ADF. ADF was highly enriched at the cell periphery in control cells (a) and Br3H cells (c); however, this enrichment was not seen in 5H cells (b). Transient transfection of TmBr3 into 5H cells alters the localization of actin depolymerizing factor. ADF has been relocalized to just behind the β-actin rich lamellipodial region and to the tips of processes (arrowhead) (d). (e) β-Actin was localized to the lamellipodial regions and to the tips of the processes. (f) Merged image of d (red) and e (green). Scale bar, 10 μm.
Figure 9
Figure 9
TmBr3 localization extends to the edge of lamellipodia, but not to the tips of microspikes. (a) 5H cells transiently transfected with TmBr3 immunostained with ADF and TmBr3 (b), showing that there is an overlap in staining at the rear of the lamellipodium as seen by the yellow color in c, a merge of a (red) and b (green). (d) DIC image of the corresponding cell. TmBr3 localization extends to the edge of the lamellipodium as shown in the merged image of (d) (red) and (b) (green) in the lower right insert. (e) TmBr3 and β-actin (f) colocalize in the lamellipodium of 5H cells transiently transfected with TmBr3. (g) Merged image of e (red) and f (green). (h) DIC image of the corresponding cell. Insert shows that TmBr3 localization extends to the edge of the lamellipodium but not to the tip of the microspikes (arrowheads, e and h). Scale bar, 10 μm.
Figure 10
Figure 10
ADF coimmunoprecipitates with TmBr3 but not with hTm5NM1. (a) hTm5NM1 was immunoprecipitated from the 5H cells using the LC1 antibody. TmBr3 was immunoprecipitated from the Br3H cells with the WSα/9c antibody. ADF was coimmunoprecipitated with TmBr3 but not hTm5NM1. Both tropomyosin isoforms were able to coimmunoprecipitate actin. LC1 does not detect TmBr3 and WSα/9c does not detect hTm5NM1. (b) ADF was coimmunoprecipitated from whole adult wild-type mouse brain using the WSα/9c antibody. The CG3 antibody that detects hTm5NM1 was unable to coimmunoprecipitate ADF. Both WSα/9c and CG3 were able to coimmunoprecipitate actin.

References

    1. Amano M, Ito M, Kimura K, Fukata Y, Chihara K, Nakano T, Matsuura Y, Kaibuchi K. Phosphorylation and activation of myosin by Rho-associated kinase (Rho-kinase) J Biol Chem. 1996;271:20246–20249. - PubMed
    1. Arber S, Barbayannis FA, Hanser H, Schneider C, Stanyon CA, Bernard O, Caroni P. Regulation of actin dynamics through phosphorylation of cofilin by LIM-kinase. Nature. 1998;393:805–809. - PubMed
    1. Bamburg JR. Proteins of the ADF/cofilin family: essential regulators of actin dynamics. Annu Rev Cell Dev Biol. 1999;15:185–230. - PubMed
    1. Bamburg JR, Bray D. Distribution and cellular localization of actin depolymerizing factor. J Cell Biol. 1987;105:2817–2825. - PMC - PubMed
    1. Beisel KW, Kennedy JE. Identification of novel alternatively spliced isoforms of the tropomyosin-encoding gene, TMnm, in the rat cochlea. Gene. 1994;143:251–256. - PubMed

Publication types

LinkOut - more resources