. 2003 Apr;77(7):4127-38.
doi: 10.1128/jvi.77.7.4127-4138.2003.

Quantitative analysis of herpes simplex virus reactivation in vivo demonstrates that reactivation in the nervous system is not inhibited at early times postinoculation

Affiliations

Quantitative analysis of herpes simplex virus reactivation in vivo demonstrates that reactivation in the nervous system is not inhibited at early times postinoculation

N M Sawtell. J Virol. 2003 Apr.

Abstract

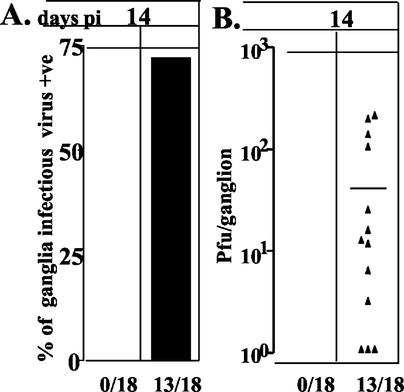
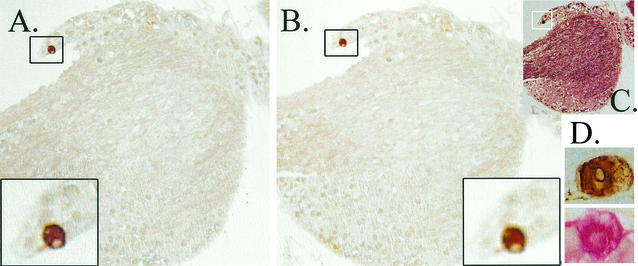
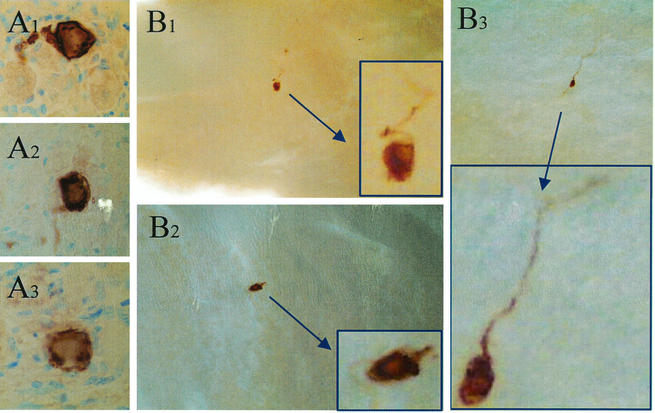
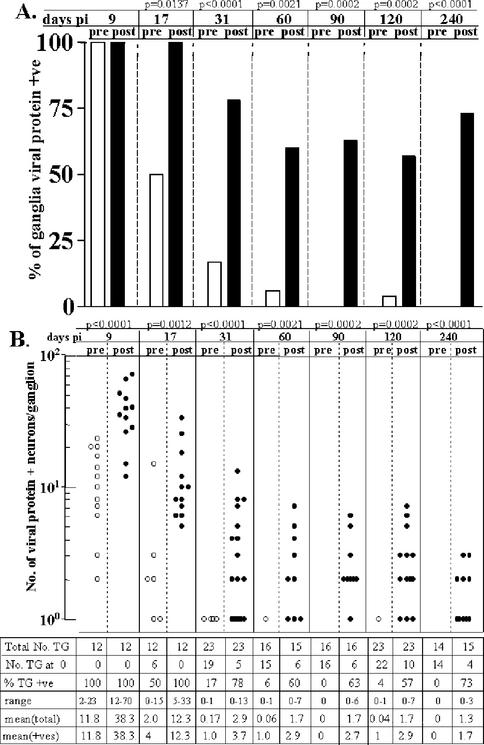
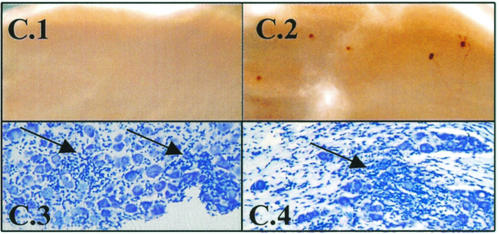
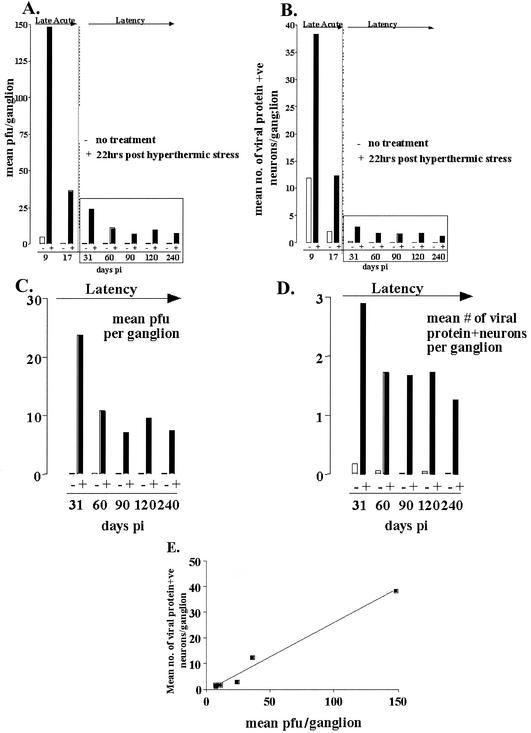
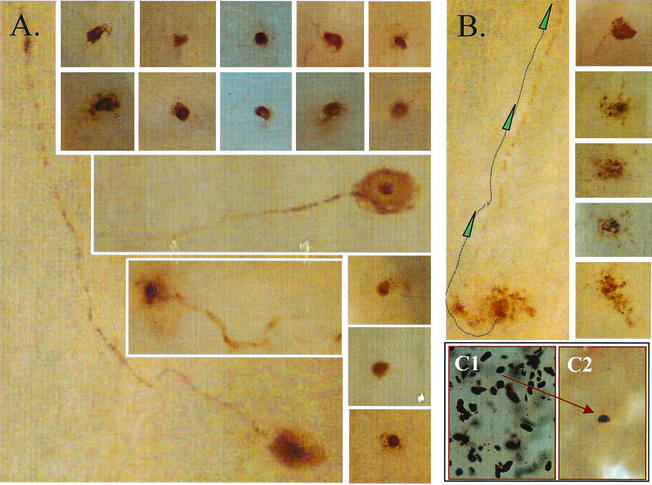
Recent studies utilizing an ex vivo mouse model of herpes simplex virus (HSV) reactivation have led to the hypothesis that, under physiologic conditions inducing viral reactivation, the immune cells within the infected ganglion block the viral replication cycle and maintain the viral genome in a latent state. One prediction from the ex vivo study is that reactivation in ganglia in vivo would be inhibited at early times postinoculation, when the numbers of inflammatory cells in the ganglia are greatest. To distinguish between an effect of the immune infiltrates on (i) infectious virus produced and/or recovered in the ganglion and (ii) the number of neurons undergoing lytic transcriptional activity (reactivating), an assay to quantify the number of neurons expressing lytic viral protein in ganglia in vivo was developed. Infectious virus and HSV protein-positive neurons were quantified from days 9 through 240 postinoculation in latently infected trigeminal ganglia before and at 22 h after hyperthermic-stress-induced reactivation. Significant increases in the amount of virus and the number of positive neurons were detected poststress in ganglia at all times examined. Unexpectedly, the greatest levels of reactivation occurred at the times examined most proximal to inoculation. Acyclovir was utilized to stop residual acute-phase virus production, and this treatment did not reduce the level of reactivation on day 14. Thus, the virus measured after induction was a product of reactivation. These data indicate that, in contrast to observations in the ex vivo model, immune cells in the ganglia during the resolution of acute infection do not inhibit reactivation of the virus in ganglia in vivo.


Figures

FIG. 1.
FIG. 1.
Infectious virus in the TG from 9 to 240 days p.i. pre-HS and 22 h post-HS induction. (A) Bar graph of the percentage of ganglia that were found to be positive for virus. (B) Scattergram of the PFU per ganglion detected. Each symbol represents the PFU in an individual ganglion. Aligned under each scattergram column is the total number of TG in that group, the number of TG at 0 (negative), the range of positive values, the mean of the total TG analyzed, and the mean of the positive (+ve) TG values. The P value (panel A, Fisher exact test; panel B, Student t test [two-tailed]) of the pre- and post-HS values appears at the top of columns for each time point examined. The total number of TG in each group is shown below the scattergram. The P value (A, Fisher exact test; B, Student t test [two-tailed]) of the pre- and post-HS values appears at the top of columns for each time point examined.
FIG. 2.
FIG. 2.
Infectious virus in the TG on day 14 p.i. of mice pre-HS and 22 h post-HS induction treated with ACV on days 6 to 12 p.i. (A) Percent ganglia in which infectious virus was detected; (B) scattergram showing the number of PFU detected in each virus-positive ganglion.
FIG. 3.
FIG. 3.
Photomicrograph series showing representative areas of the TG after WGIHC with an anti-HSV antibody as described in Material and Methods. Viral protein expression is shown over time in the TG of mice after corneal inoculation with HSV type 1 strain 17syn+. (A to D) Representative samples from days 1 to 4 p.i., respectively. (D1 and D2) Images obtained at day 4 p.i., indicating the range of immunostaining observed at this time. The boxed region, shown enlarged to the right of D1, shows a neuron (N−) that is devoid of detectable HSV protein but surrounded by satellite cells (arrowheads) that are positive. N+, neuron positively stained. (E to G) Images representative of days 5, 7, and 30 p.i., respectively. (Insets, E and F) Viral protein was detected in axonal tracts through day 4 (arrows and insets) but was not observed at later times p.i.. (H) Acute viral replication curve.
FIG. 4.
FIG. 4.
Analysis of penetration of IHC reagents into the TG. TG were first assayed for viral proteins by using WGIHC. These ganglia were then embedded in paraffin, serially sectioned, and restained by using the anti-HSV antibody and a red chromagenic substrate as detailed in Materials and Methods. (A) Portion of a latently infected TG at 22 h post-HS containing a single viral-protein-positive neuron (box). This neuron was detected during WGIHC. (B) After restaining, no additional viral protein staining was detected. (C) The same section as in panel B after being stained with a neurofilament antibody and VIP (Vector) as the chromagenic substrate, confirming that processing had not destroyed antigenicity of the tissue. (D) Brown (diaminobenzidine)- and red (Fast Red)-stained neurons.
FIG. 5.
FIG. 5.
Analysis of viral protein expression in TG of latently infected mice at 22 h post-HS by using an anti-HSV antibody on serially sectioned ganglia (A1 to A3) or whole ganglia (B1 to B3). Insets show higher magnifications of immunostained neurons.
FIG. 6.
FIG. 6.
Viral protein expression in the TG from 9 to 240 days p.i. before and 22 h post-HS induction. (A) Bar graph of the percentage of ganglia that were found to be positive for viral proteins by using WGIHC. (B) Scattergram of the number of positive neurons per ganglion detected. Each symbol represents the value obtained for an individual ganglion. Aligned under each scattergram column is the total number of TG in that group, the number of TG at 0 (negative), the range of positive values, the mean of the total TG analyzed, and the mean of the positive (+ve) TG values. The P value (panel A, Fisher exact test; panel B, Student t test [two-tailed]) of the pre- and post-HS values appears at the top of columns for each time point examined. (C) Example of latently infected ganglia on day 17 pre-HS induction (C.1) and 22 h post-HS induction (C.2). These TG were subsequently embedded and stained with cresyl violet. Areas of inflammatory infiltrate were present before (C.3) and after induction (C.4) (arrows).
FIG. 6.
FIG. 6.
Viral protein expression in the TG from 9 to 240 days p.i. before and 22 h post-HS induction. (A) Bar graph of the percentage of ganglia that were found to be positive for viral proteins by using WGIHC. (B) Scattergram of the number of positive neurons per ganglion detected. Each symbol represents the value obtained for an individual ganglion. Aligned under each scattergram column is the total number of TG in that group, the number of TG at 0 (negative), the range of positive values, the mean of the total TG analyzed, and the mean of the positive (+ve) TG values. The P value (panel A, Fisher exact test; panel B, Student t test [two-tailed]) of the pre- and post-HS values appears at the top of columns for each time point examined. (C) Example of latently infected ganglia on day 17 pre-HS induction (C.1) and 22 h post-HS induction (C.2). These TG were subsequently embedded and stained with cresyl violet. Areas of inflammatory infiltrate were present before (C.3) and after induction (C.4) (arrows).
FIG. 7.
FIG. 7.
Graphic representation of mean PFU per TG (A) and mean number of viral-protein-expressing neurons per TG (B) pre-HS and 22 h post-HS in mice from 9 to 240 days p.i. (C and D) The results from days 31 to 240 p.i. are shown on expanded scales. (E) Correlation of 0.99 (Pearson r value, P < 0.0001) was found between the mean PFU per ganglion and the mean number of viral-protein-positive neurons per ganglion at 22 h post-HS from days 9 to 240 p.i.
FIG. 8.
FIG. 8.
Photomicrographs of viral-protein-expressing neurons post-HS of latently infected animals. (A) Examples of neurons expressing viral proteins 22 h post-HS. Note that viral proteins can often be detected in the axon, as well as in the cell body. (B) Ganglia examined at 48 h post-HS contained viral-protein-positive neurons that appeared to be undergoing destruction. The presence of viral protein in the axon confirms that this cell is a neuron. (C) Care must be taken to avoid pieces of lacrimal gland during the dissection of the TG (see Materials and Methods). These glands contain very dark brown or black structures (C1), as shown here, that can be misinterpreted as stained neurons if allowed to contaminate the ganglion preparation (C2).

References

    1. Bauer, D., and R. Tampe. 2002. Herpes viral proteins blocking the transporter associated with antigen processing TAP: from genes to function and structure. Curr. Top. Microbiol. Immunol. 269:87-99. - PubMed
    1. Blue, W. T., R. D. Winland, D. G. Stobbs, D. F. Kirksey, and R. E. Savage. 1981. Effects of adenosine monophosphate on the reactivation of latent herpes simplex virus type 1 infections of mice. Antimicrob. Agents Chemother. 20:547-548. - PMC - PubMed
    1. Blyth, W. A., T. J. Hill, H. J. Field, and D. A. Harbour. 1976. Reactivation of herpes simplex virus infection by ultraviolet light and possible involvement of prostaglandins. J. Gen. Virol. 33:547-550. - PubMed
    1. Card, J. P., P. Levitt, and L. W. Enquist. 1998. Different patterns of neuronal infection after intracerebral injection of two strains of pseudorabies virus. J. Virol. 72:4434-4441. - PMC - PubMed
    1. Dent, J. A., A. G. Polson, and M. W. Klymkowsky. 1989. A whole-mount immunocytochemical analysis of the expression of the intermediate filament protein vimentin in Xenopus. Development 105:61-74. - PubMed

Publication types

MeSH terms