. 2003 Mar;4(3):313-9.
doi: 10.1038/sj.embor.embor767.

Dynamics of the interaction between the insulin receptor and protein tyrosine-phosphatase 1B in living cells

Affiliations

Dynamics of the interaction between the insulin receptor and protein tyrosine-phosphatase 1B in living cells

Nicolas Boute et al. EMBO Rep. 2003 Mar.

Abstract

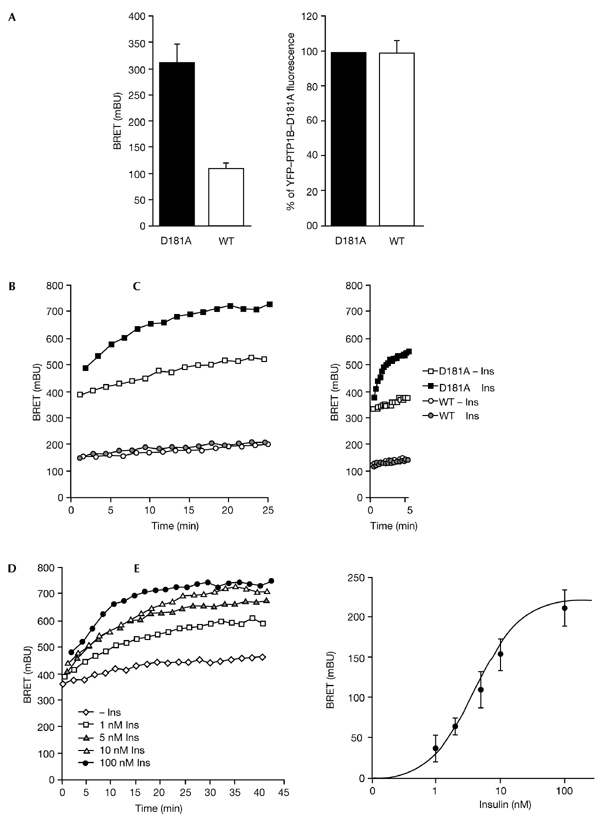
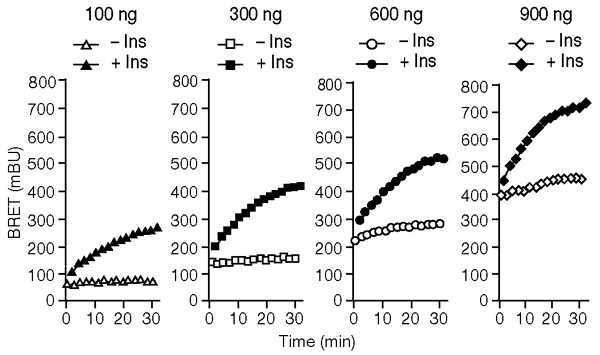
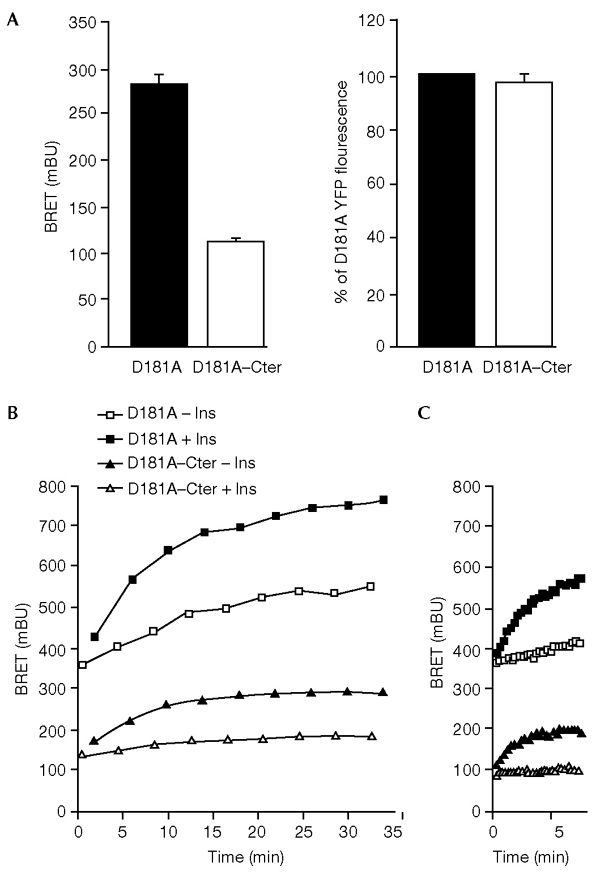
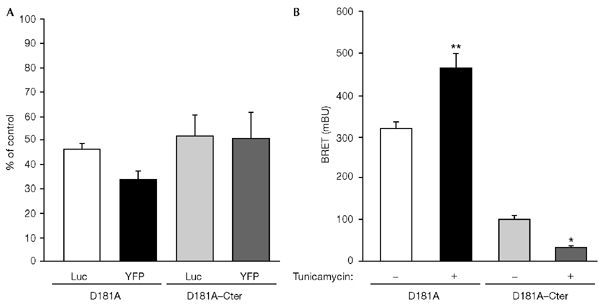
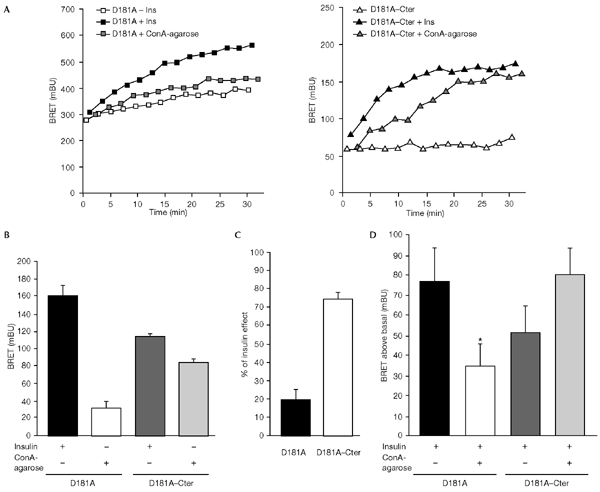
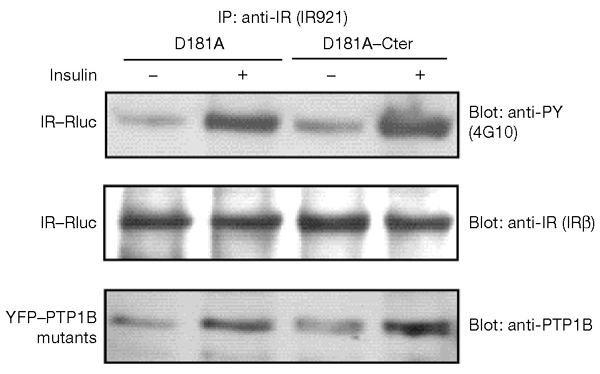
The dynamics of the interaction of the insulin receptor with a substrate-trapping mutant of protein-tyrosine phosphatase 1B (PTP1B) were monitored in living human embryonic kidney cells using bioluminescence resonance energy transfer (BRET). Insulin dose-dependently stimulates this interaction, which could be followed in real time for more than 30 minutes. The effect of insulin on the BRET signal could be detected at early time-points (30 seconds), suggesting that in intact cells the tyrosine-kinase activity of the insulin receptor is tightly controlled by PTP1B. Interestingly, the basal (insulin-independent) interaction of the insulin receptor with PTP1B was much weaker with a soluble form of the tyrosine-phosphatase than with the endoplasmic reticulum (ER)-targeted form. Inhibition of insulin-receptor processing using tunicamycin suggests that the basal interaction occurs during insulin-receptor biosynthesis in the ER. Therefore, localization of PTP1B in this compartment might be important for the regulation of insulin receptors during their biosynthesis.


Figures

Figure 1
Figure 1
Expression of yellow fluorescent protein (YFP) fusion constructs in human embryonic kidney (HEK)-293 cells. Cells were transfected with complementary DNAs encoding either YFP or YFP-tagged protein-tyrosine phosphatase 1B (PTP1B) constructs. Expression of YFP in HEK-293 cells results in a fluorescent signal distributed uniformly throughout the cell (A). Expression of wild-type YFP–PTP1B (B) or YFP–PTP1B–D181A (C) results in an intracellular and perinuclear distribution of the fluorescence.
Figure 2
Figure 2
Dynamics of the interaction between the insulin receptor (IR) and protein-tyrosine phosphatase 1B (PTP1B) in intact living cells. (A) Basal bioluminescence resonance energy transfer (BRET) signal (left panel) and yellow fluorescent protein (YFP) fluorescence (right panel) in human embryonic kidney (HEK) cells co-expressing IR–Rluc—a fusion of the IR to Renilla luciferase (Rluc)—and YFP-tagged forms of either wild-type (WT) PTP1B or the D181A mutant form of PTP1B. Results are expressed as the mean ± s.e.m. (n = 5). (B) HEK cells co-expressing IR–Rluc and either YFP–PTP1B or YFP–PTP1B–D181A were incubated either in the absence of insulin, or in the presence of 100 nM insulin. (C) Early effect of insulin on the interaction between the IR and PTP1B. Results are representative of at least five independent experiments. (D) Dose-dependent effect of insulin on the interaction of the IR with the YFP–PTP1B–D181A substrate-trapping mutant. HEK cells were incubated either in the absence of insulin or the presence of different concentrations of insulin. (E) Dose-response curve of the insulin-induced BRET signal at t=20 min. Results are the mean ± s.e.m. of 4–7 independent experiments. Ins, insulin.
Figure 3
Figure 3
Effect of expressing increasing amounts of a yellow fluorescent protein (YFP)-tagged form of the PTP1B D181A-mutant protein (YFP–PTP1B–D181A) in human embryonic kidney cells. The bioluminescence resonance energy transfer (BRET) signal was measured, either in the absence of insulin or in the presence of 100 nM insulin, in cells co-expressing IR–Rluc—a fusion of the insulin receptor (IR) to Renilla luciferase Rluc. For each transfection, 300 ng of IR–Rluc DNA was used. Different amounts of YFP–PTP1B–D181A DNA (100 ng, 300 ng, 600ng and 900 ng) were used in each transfection. Results are representative of three independent experiments. Ins, insulin.
Figure 4
Figure 4
Interaction of the insulin receptor (IR) with the soluble and endoplasmic-reticulum-targeted forms of the protein-tyrosine phosphatase 1B (PTP1B) D181A mutant protein. (A) Basal bioluminescence resonance energy transfer (BRET) signal (left panel) and yellow fluorescent protein (YFP) fluorescence (right panel) in human embryonic kidney (HEK) cells co-expressing IR–Rluc—a fusion of the insulin receptor (IR) to Renilla luciferase—and YFP-tagged fusions of either the D181A mutant protein (YFP–PTP1B–D181A) or a soluble form of this mutant protein (YFP–PTP1B–D181A–Cter). Results are expressed as the mean ± s.e.m. (n = 6). (B) HEK cells co-transfected with IR–Rluc and either YFP–PTP1B–D181A or YFP–PTP1B–D181A–Cter were incubated either in the absence of insulin or in the presence of 100 nM insulin. BRET was used to measure the interaction between IR–Rluc and the PTP1B–D181A proteins. (C) Comparison of the initial rate of association of the IR with either PTP1B–D181A or PTP1B–D181A–Cter. Results are representative of at least three independent experiments. Ins, insulin.
Figure 5
Figure 5
Effect of tunicamycin on basal bioluminescence resonance energy transfer (BRET) signal. Human embryonic kidney cells were cotransfected with a fusion of the insulin receptor (IR) to Renilla luciferase (IR–Rluc) and yellow fluorescent protein (YFP)-tagged fusions of either the protein-tyrosine phosphatase 1B (PTP1B) D181A mutant protein (YFP–PTP1B–D181A) or a soluble form of this mutant protein (YFP–PTP1B–D181A–Cter). Transfected cells were cultured for 48 h either in the absence of tunicamycin, or in the presence of 1 μg ml−1 of tunicamycin. (A) Luciferase activity (Luc) and YFP fluorescence in tunicamycin-treated cells expressed as a percentage of the levels obtained in untreated cells. Results are expressed as the mean ± s.e.m. (n = 4). (B) Basal BRET signal in control (untreated) and tunicamycin-treated cells. Results are expressed as the mean ± s.e.m. (n = 6). *, P < 0.05; **, P < 0.001.
Figure 6
Figure 6
Effect of concanavalin A (ConA)-agarose on the interaction of the insulin receptor (IR) with the soluble and endoplasmic-reticulum (ER)-targeted forms of the protein-tyrosine phosphatase 1B (PTP1B) D181A mutant, as measured by bioluminescence resonance energy transfer (BRET). Cells were stimulated with either ConA-agarose (25 μl of beads per well) or 100 nM insulin. (A) A representative experiment is shown; results for the ER-targeted form of the D181A mutant are shown in the left panel, and those for the soluble form (D181A–Cter) in the right panel. (B) Results of seven or eight independent experiments carried out as described in (A) with BRET measurements taken at t = 25 min are shown, expressed as the mean ± s.e.m. (C) Data from (B) expressed as a percentage of the insulin-induced BRET signal. (D) Human embryonic kidney cells co-transfected with a fusion of the IR to Renilla luciferase (IR–Rluc) and either YFP–PTP1B–D181A or YFP–PTP1B–D181A–Cter were pre-incubated for 20 min in the absence or presence of ConA-agarose. Cells were then incubated for 10 min with 5 nM insulin. The level of the BRET signal above the basal level is shown. Results are expressed as the mean ± s.e.m. of 3–5 independent experiments (*, P < 0.05 when compared with cells not pre-incubated with ConA-agarose). Ins, insulin.
Figure 7
Figure 7
Co-immunoprecipitation of yellow fluorescent protein (YFP)-tagged endoplasmic-reticulum (ER)-targeted and soluble forms of the protein-tyrosine phosphatase 1B (PTP1B) D181A mutant with the insulin receptor (IR). Human embryonic kidney cells co-expressing a fusion of the IR to Renilla luciferase (IR–Rluc) and either the ER-targeted form (D181A) or the soluble form (D181A–Cter) of PTP1B D181A were incubated for 10 min either in the absence of insulin, or in the presence of 100 nM insulin. Immunoprecipitation was carried out using the IR921 antibody. The amounts of IR–Rluc and PTP1B D181A mutant proteins in the immunoprecipitates were assessed by immunoblotting with anti-IR and anti-PTP1B antibodies. Results are representative of three independent experiments.

Similar articles

Cited by

References

    1. Angers S., Salahpour A., Joly E., Hilairet S., Chelsky D., Dennis M. & Bouvier M. (2000) Detection of beta 2-adrenergic receptor dimerization in living cells using bioluminescence resonance energy transfer (BRET). Proc. Natl Acad. Sci. USA, 97, 3684–3689. - PMC - PubMed
    1. Bandyopadhyay D., Kusari A., Kenner K.A., Liu F., Chernoff J., Gustafson T.A. & Kusari J. (1997) Protein-tyrosine phosphatase 1B complexes with the insulin receptor in vivo and is tyrosine-phosphorylated in the presence of insulin. J. Biol. Chem., 272, 1639–1645. - PubMed
    1. Boute N., Pernet K. & Issad T. (2001) Monitoring the activation state of the insulin receptor using bioluminescence resonance energy transfer. Mol. Pharmacol., 60, 640–645. - PubMed
    1. Boute N., Jockers R. & Issad T. (2002) The use of resonance energy transfer in high-throughput screening: BRET versus FRET. Trends Pharmacol. Sci., 23, 351–354. - PubMed
    1. Burgess J.W., Wada I., Ling N., Khan M.N., Bergeron J.J. & Posner B.I. (1992) Decrease in betasubunit phosphotyrosine correlates with internalization and activation of the endosomal insulin receptor kinase. J. Biol. Chem., 267, 10077–10086. - PubMed

Publication types

MeSH terms

Substances