

Early- and late-state subacute sclerosing panencephalitis: chemical shift imaging and single-voxel MR spectroscopy
- PMID: 12637304
- PMCID: PMC7973591
Early- and late-state subacute sclerosing panencephalitis: chemical shift imaging and single-voxel MR spectroscopy
Abstract
Background and purpose: Subacute sclerosing panencephalitis (SSPE) is a rare, progressive, inflammatory neurodegenerative disease. Our aim was to determine the metabolic abnormalities of brain in early- and late-stage SSPE by using MR spectroscopy and to assess areas of involvement in the early stages when MR imaging findings were normal.
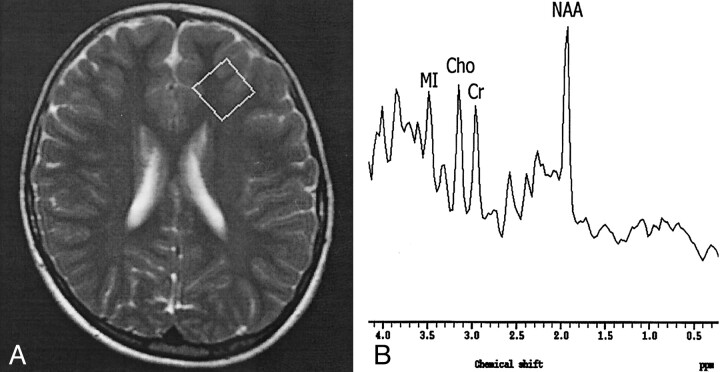
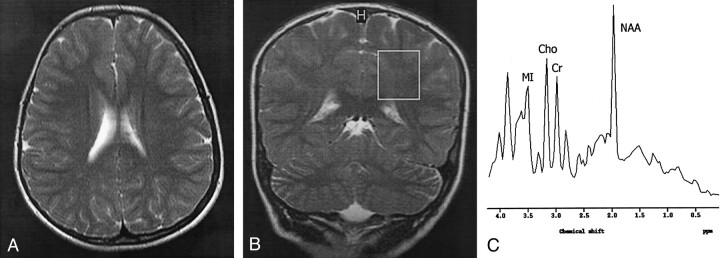
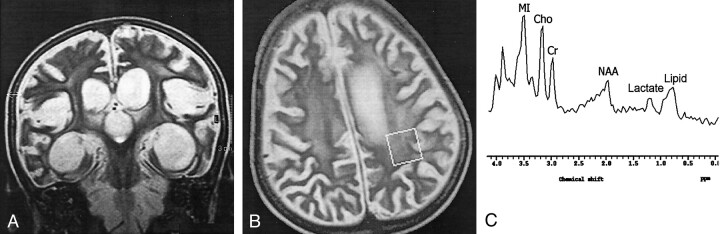
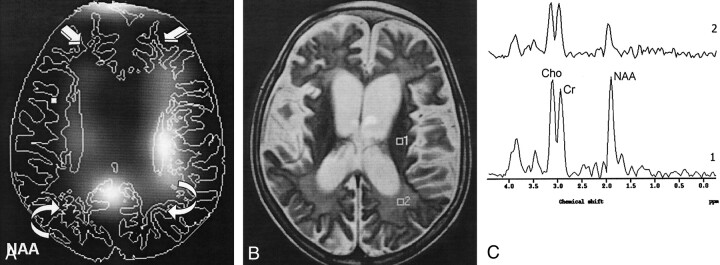
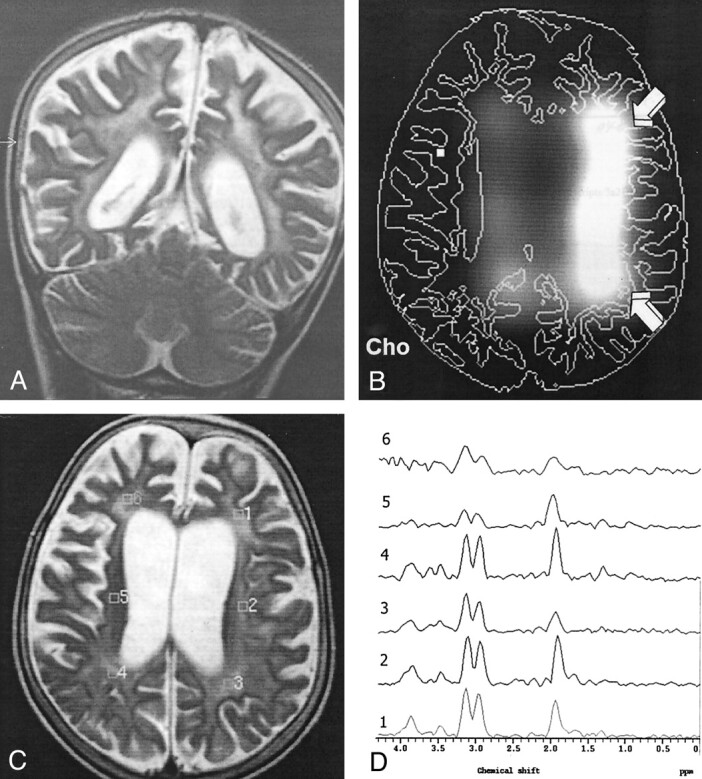
Methods: Children with stage II (n = 3) or III (n = 3) SSPE and 10 healthy, age-matched children underwent MR imaging, multivoxel MR spectroscopy, and short-echo single-voxel MR spectroscopy (SVS). Areas of involvement in the brain were determined with chemical shift imaging. For SVS, 2 x 2 x 2-cm voxels were placed in the frontal subcortical white matter (FSWM) and parieto-occipital white matter (POWM). N-acetylaspartate (NAA)/creatine (Cr), choline (Cho)/Cr, myo-inositol (Ins)/Cr, and NAA/Cho ratios were calculated.
Results: Comparisons of NAA/Cr, Cho/Cr, Ins/Cr and NAA/Cho ratios between patients and control subjects showed significant differences in FSWM and POWM (P <.01). In patients with SSPE, NAA/Cr ratios in POWM were significantly less than those in FSWM (P <.01). NAA/Cr ratios in patients with stage II SSPE and those in the control group were not significantly different; this may reflect the absence of neuronal loss. Decreased NAA/Cr, increased Cho/Cr and Ins/Cr ratios, and increased lactate and lipid peaks were found in patients with stage III SSPE.
Conclusion: MR spectroscopy showed findings suggestive of inflammation in stage II and findings of demyelination, gliosis, cellular necrosis, and anaerobic metabolism in stage III. MR spectroscopy could be a promising technique for early diagnosis and treatment planning in cases of SSPE.
Figures
References
-
- Tuncay R, Demir GA, Gokyigit A, et al. MRI in subacute sclerosing panencephalitis. Neuroradiology 1996;38:636–640 - PubMed
-
- Dyken PR. Subacute sclerosing panencephalitis: current status. Neurol Clin 1985;3:179–196 - PubMed
-
- Ozturk A, Gurses C, Baykan B, Gokyigit A, Eraksoy M. Subacute sclerosing panencephalitis: Clinical and magnetic resonance imaging evaluation of 36 patients. J Child Neurol 2002;17:25–29 - PubMed
MeSH terms
Substances
LinkOut - more resources
Full Text Sources
Medical