. 2003 Mar 17;160(6):845-55.
doi: 10.1083/jcb.200209079.

PAR-dependent and geometry-dependent mechanisms of spindle positioning

Affiliations

PAR-dependent and geometry-dependent mechanisms of spindle positioning

Meng-Fu Bryan Tsou et al. J Cell Biol. .

Abstract

During intrinsically asymmetric division, the spindle is oriented onto a polarized axis specified by a group of conserved PAR proteins. Extrinsic geometric asymmetry generated by cell shape also affects spindle orientation in some systems, but how intrinsic and extrinsic mechanisms coexist without interfering with each other is unknown. In some asymmetrically dividing cells of the wild-type Caenorhabditis elegans embryo, nuclear rotation directed toward the anterior cortex orients the forming spindle. We find that in such cells, a PAR-dependent mechanism dominates and causes rotation onto the polarized axis, regardless of cell shape. However, when geometric asymmetry is removed, free nuclear rotation in the center of the cell is observed, indicating that the anterior-directed nature of rotation in unaltered embryos is an effect of cell shape. This free rotation is inconsistent with the prevailing model for nuclear rotation, the specialized cortical site model. In contrast, in par-3 mutant embryos, a geometry-dependent mechanism becomes active and causes directed nuclear rotation. These results lead to the model that in wild-type embryos both PAR-3 and PAR-2 are essential for nuclear rotation in asymmetrically dividing cells, but that PAR-3 inhibits geometry-dependent rotation in nonpolarized cells, thus preventing cell shape from interfering with spindle orientation.


Figures

Figure 1.
Figure 1.
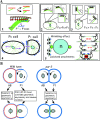
Two models for nuclear rotation. P1 blastomeres are shown; the region of cell contact with AB, which is anterior, is to the left. Microtubules and centrosomes are shown in green. (A) The cortical site model. The anterior cortical site enriched for dynactin is shown in red. During movement of the nucleus to the center of the cell (centration) any slight perturbation that tilts the nuclear–centrosome complex results in capture of microtubules from one centrosome; capture and shortening of microtubules causes nuclear rotation directed toward the cortical site and results in one centrosome being closely associated with the anterior cortex. (B) The LET-99 band model. Thick blue lines indicate the peripheral region enriched for LET-99 that appears during prophase as a band encircling the P cells. The proposed effect of the LET-99 band is to decrease force between the cortex and astral microtubules (−), compared with the force at the remainder of the periphery (+). After centration, any stochastic tilt of the nuclear–centrosome complex would lead to free rotational movement with the nucleus located centrally and the two centrosomes equidistant from anterior and posterior.
Figure 2.
Figure 2.
Wild-type spherical P1 cells show free nuclear rotation unaffected by geometry. Time-lapse video microscopy series of unaltered (A–E) and spherical (F–S) wild-type P1 blastomeres; embryo in series K–O has an ectopic flat surface on top. Each row shows a single embryo. Anterior is to the left in this and all subsequent figures. Centrosomes were visualized with GFP-labeled tubulin (A–C and F–H), or by DIC microscopy. (A–J) Comparison of nuclear rotation and centrosome positioning in unaltered (A–E) and spherical (F–J) P1 cells. DIC images (D and I) were taken immediately after the last epifluorescence image, and merged (E and J) to show the relative position of the centrosomes to the cortex. Arrows and bars (E and J) indicate the anterior cortex of P1 cells. (K–O) Wild-type embryo mounted on agar; the posterior blastomere is “spherical” in terms of the cell contact region, but had an ectopic flat side on top (parallel with the page) from the weight of the coverslip. Arrowheads (M and N) indicate centrosome position after nuclear rotation. (P–S) Higher magnification of a wild-type embryo with a spherical P1 after nuclear rotation, showing a membrane invagination (arrow) that protrudes into the AB cell but not the P1. Arrowheads indicate centrosome position. (T and U) Quantitative analysis of the nuclear and centrosome position immediately after nuclear rotation in unaltered (n = 10) and spherical (n = 9) P1 cells. (T) Positions of centrosomes and nuclei after nuclear rotation were quantified as percentage of cell length (see diagram; a, anterior; p, posterior) for each embryo. (U) The ratios of the distances from centrosomes to the anterior cortex (λ) and posterior cortex (r) were expressed as λ/r. The mean and SD for each group is shown. Bars, 10 μm.
Figure 2.
Figure 2.
Wild-type spherical P1 cells show free nuclear rotation unaffected by geometry. Time-lapse video microscopy series of unaltered (A–E) and spherical (F–S) wild-type P1 blastomeres; embryo in series K–O has an ectopic flat surface on top. Each row shows a single embryo. Anterior is to the left in this and all subsequent figures. Centrosomes were visualized with GFP-labeled tubulin (A–C and F–H), or by DIC microscopy. (A–J) Comparison of nuclear rotation and centrosome positioning in unaltered (A–E) and spherical (F–J) P1 cells. DIC images (D and I) were taken immediately after the last epifluorescence image, and merged (E and J) to show the relative position of the centrosomes to the cortex. Arrows and bars (E and J) indicate the anterior cortex of P1 cells. (K–O) Wild-type embryo mounted on agar; the posterior blastomere is “spherical” in terms of the cell contact region, but had an ectopic flat side on top (parallel with the page) from the weight of the coverslip. Arrowheads (M and N) indicate centrosome position after nuclear rotation. (P–S) Higher magnification of a wild-type embryo with a spherical P1 after nuclear rotation, showing a membrane invagination (arrow) that protrudes into the AB cell but not the P1. Arrowheads indicate centrosome position. (T and U) Quantitative analysis of the nuclear and centrosome position immediately after nuclear rotation in unaltered (n = 10) and spherical (n = 9) P1 cells. (T) Positions of centrosomes and nuclei after nuclear rotation were quantified as percentage of cell length (see diagram; a, anterior; p, posterior) for each embryo. (U) The ratios of the distances from centrosomes to the anterior cortex (λ) and posterior cortex (r) were expressed as λ/r. The mean and SD for each group is shown. Bars, 10 μm.
Figure 3.
Figure 3.
Nuclear rotation in par-3 embryos is a consequence of geometric effects. Time-lapse video microscopy series of unaltered (A–J) and spherical (F–X) par-3 blastomeres; embryo in series P–T has an ectopic flat surface on top. Each row shows a single embryo. Centrosomes were visualized with GFP-labeled tubulin (A–J), or by DIC microscopy. (A–E) Embryo in which the centrosomes in each blastomere migrated onto a transverse axis (C and D), and then nuclear rotation directed toward the cell contact region occurred (E). (F–J) Embryo in which the central spindle was displaced laterally (compare arrows in G and B) at first cleavage, resulting in mispositioned centrosomes (compare insets). The centrosomes migrated onto the longitudinal axis (H and I), giving rise to a longitudinal spindle in the absence of rotation (J). (K–O) Embryo with a spherical posterior blastomere. Centrosomes (arrowheads) migrated onto a transverse axis (N) and no rotation occurred, resulting in a transverse spindle (O). (P–T) Embryo mounted on agar; the posterior blastomere is “spherical” in terms of the cell contact region, but had an ectopic flat side on top from the weight of the coverslip. The nuclear–centrosome complex oriented toward the coverslip (R, one centrosome is visible; arrowhead); the nucleus was also closer to the coverslip. As spindle elongation occurred, the spindle moved onto the other transverse axis, which is the long axis of the cell under these flattened conditions. (U–X) Higher magnification of an embryo with a spherical posterior blastomere. A membrane invagination (arrow) protrudes into the left blastomere in this embryo, as well as in the embryo shown in K–O. Arrowheads indicate centrosome position. No nuclear rotation during prophase was observed, but the spindle skewed onto an oblique axis at it elongated. Bars, 10 μm.
Figure 4.
Figure 4.
let-99 is required for par-3 embryos to be sensitive to geometric effects. (A–F) Time-lapse series of a two-cell par-3;let-99 double RNAi embryo. The centrosomes were visualized with GFP-tubulin (A–E) and then the final division pattern shown by DIC microscopy (F). In this example, hyperactive centrosome movements were observed in which the nuclear–centrosome complex in the posterior cell moved from a 45° angle (B) to longitudinal (C) then to a left/right orientation (D and E). (G) Quantification of changes in nuclear–centrosome positioning in par-3;let-99 double RNAi embryos. The initial and final position of the centrosomes were scored after centrosomes were separated and during nuclear envelope breakdown respectively. A/P, anterior/posterior; D/V, dorsal/ventral; L/R, left/right; n, total number in that category. All par-3;let-99 double RNAi embryos exhibited a symmetric first cleavage and synchronous second cleavage, indicating that the par-3 RNAi was effective. Bar, 10 μm.
Figure 5.
Figure 5.
Models for geometry- dependent and PAR-dependent nuclear rotation. (A) A physical model for geometric effects on nuclear movements in the absence of polarity in par-3 mutant embryos. Microtubules are shown in green, motor molecules in red, and nuclei (n) in blue. (1) Microtubules in lateral association with cortex. The force vector toward the cortex (F′′, purple arrows) equals the sliding force (F′, blue arrows) times cosine of the angle with the cortex (θ). Inset shows bending of microtubules; stiffness prevents microtubules from associating with angles larger than 90°. (2 and 3) Microtubules that contact the cortex with small angles will experience greater force vectors toward the cortex. Note that in par-3 one-cell embryos, the pronuclei meet in the center. (4) Tilting of the nuclear–centrosome complex by dynamic perturbation will lead to sliding (blue arrows) of microtubules in the direction that establishes smaller association angles, that is toward the poles in P0 (left) or along the flat side in P1 (right). Sliding of microtubules on the cortex produces a force on the centrosomes (purple arrows). (5) Final position of the nuclear centrosome complex in a flat-sided cell. The polarized force produced by the microtubules (blue arrows) is predicted to produce an opposite force on the cell cortex (black arrows) that causes a localized invagination pointing out toward the centrosome. This proposed interaction is analogous to the wrinkling effect on a carpet during a game of tug-of-war (right diagrams; blue and black arrows are analogous to forces shown in the left diagram, red arrows show movements or fluctuations of the central position of the two opposing forces, and “stop” indicates the final position after equilibration of opposing forces; see text for explanation). (B) Model for the function of PAR-3 and LET-99 in polarized and nonpolarized cells of wild-type embryos. PAR-3 is shown in red, LET-99 in blue with enriched areas represented by thick lines.

References

    1. Adames, N.R., and J.A. Cooper. 2000. Microtubule interactions with the cell cortex causing nuclear movements in Saccharomyces cerevisiae J. Cell Biol. 120:863–874. - PMC - PubMed
    1. Bowerman, B., and C.A. Shelton. 1999. Cell polarity in the early Caenorhabditis elegans embryo. Curr. Opin. Genet. Dev. 9:390–395. - PubMed
    1. Boyd, L., S. Guo, D. Levitan, D.T. Stinchcomb, and K.J. Kemphues. 1996. PAR-2 is asymmetrically distributed and promotes association of P granules and PAR-1 with the cortex in C. elegans embryos. Development. 122:3075–3084. - PubMed
    1. Brenner, S. 1974. The genetics of Caenorhabditis elegans. Genetics. 77:71–94. - PMC - PubMed
    1. Cheng, N.N., C. Kirby, and K.J. Kemphues. 1995. Control of cleavage spindle orientation in C. elegans: the role of the par-2 and par-3 genes. Genetics. 139:549–555. - PMC - PubMed

Publication types

MeSH terms

Substances