

Dynamics of endogenous cytokinin pools in tobacco seedlings: a modelling approach
- PMID: 12646503
- PMCID: PMC4242250
- DOI: 10.1093/aob/mcg061
Dynamics of endogenous cytokinin pools in tobacco seedlings: a modelling approach
Abstract
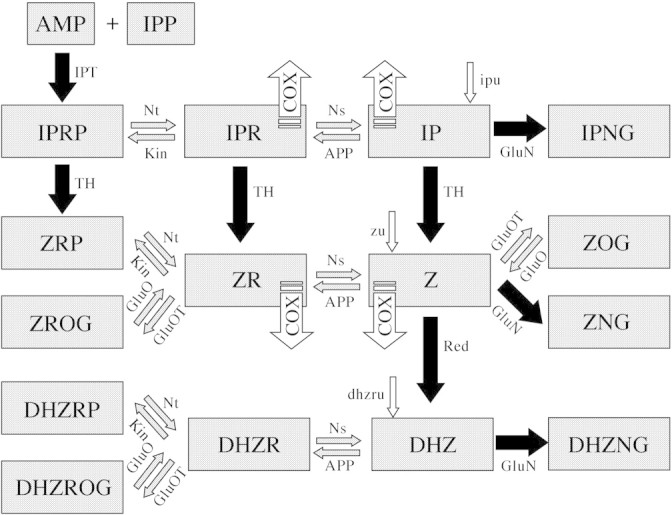
Recent advances in cytokinin analysis have made it possible to measure the content of 22 cytokinin metabolites in the tissue of developing tobacco seedlings. Individual types of cytokinins in plants are interconverted to their respective forms by several enzymatic activities (5'-AMP-isopentenyltransferase, adenosine nucleosidase, 5'-nucleotidase, adenosine phosphorylase, adenosine kinase, trans-hydroxylase, zeatin reductase, beta-glucosidase, O-glucosyl transferase, N-glucosyl transferase, cytokinin oxidase). This paper reports modelling and measuring of the dynamics of endogenous cytokinins in tobacco plants grown on media supplemented with isopentenyl adenine (IP), zeatin (Z) and dihydrozeatin riboside (DHZR). Differences in phenotypes generated by the three cytokinins are shown and discussed, and the assumption that substrate concentration drives enzyme kinetics underpinned the construction of a simple mathematical model of cytokinin metabolism in developing seedlings. The model was tested on data obtained from liquid chromatography/tandem mass spectrometry cytokinin measurements on tobacco seedlings grown on Murashige and Skoog agar nutrient medium, and on plants grown in the presence of IP, Z and DHZR. A close match was found between measured and simulated data, especially after a series of iterative parameter searches, in which the parameters were set to obtain the best fit with one of the data sets.
Figures


Similar articles
-
Endogenous cytokinin profiles of tissue-cultured and acclimatized 'Williams' bananas subjected to different aromatic cytokinin treatments.Plant Sci. 2014 Jan;214:88-98. doi: 10.1016/j.plantsci.2013.09.012. Epub 2013 Oct 2. Plant Sci. 2014. PMID: 24268166
-
Ectopic over-expression of the maize beta-glucosidase Zm-p60.1 perturbs cytokinin homeostasis in transgenic tobacco.J Exp Bot. 2006;57(4):985-96. doi: 10.1093/jxb/erj084. Epub 2006 Feb 17. J Exp Bot. 2006. PMID: 16488914
-
Biochemical characterization of the maize cytokinin dehydrogenase family and cytokinin profiling in developing maize plantlets in relation to the expression of cytokinin dehydrogenase genes.Plant Physiol Biochem. 2014 Jan;74:283-93. doi: 10.1016/j.plaphy.2013.11.020. Epub 2013 Nov 28. Plant Physiol Biochem. 2014. PMID: 24333683
-
The Hulks and the Deadpools of the Cytokinin Universe: A Dual Strategy for Cytokinin Production, Translocation, and Signal Transduction.Biomolecules. 2021 Feb 3;11(2):209. doi: 10.3390/biom11020209. Biomolecules. 2021. PMID: 33546210 Free PMC article. Review.
-
Regulation of cytokinin biosynthesis, compartmentalization and translocation.J Exp Bot. 2008;59(1):75-83. doi: 10.1093/jxb/erm157. Epub 2007 Sep 14. J Exp Bot. 2008. PMID: 17872922 Review.
Cited by
-
Differential regulation of cytokinin oxidase genes and cytokinin-induced auxin biosynthesis by cellular cytokinin level in transgenic poplars.Plant Cell Rep. 2014 Oct;33(10):1737-44. doi: 10.1007/s00299-014-1652-1. Epub 2014 Jul 22. Plant Cell Rep. 2014. PMID: 25048021
-
Early cytokinin response proteins and phosphoproteins of Arabidopsis thaliana identified by proteome and phosphoproteome profiling.J Exp Bot. 2011 Jan;62(3):921-37. doi: 10.1093/jxb/erq322. Epub 2010 Oct 25. J Exp Bot. 2011. PMID: 20974740 Free PMC article.
-
A potential role for endogenous microflora in dormancy release, cytokinin metabolism and the response to fluridone in Lolium rigidum seeds.Ann Bot. 2015 Feb;115(2):293-301. doi: 10.1093/aob/mcu231. Epub 2014 Dec 2. Ann Bot. 2015. PMID: 25471097 Free PMC article.
References
-
- ArmstrongDJ.1994. Cytokinin oxidase and the regulation of cytokinin degradation. In: Mok DWS, Mok MC, eds. Cytokinins: chemistry, activity and function Boca Raton: CRC Press, 139–153.
-
- BieleskiRL.1964. The problem of halting enzyme action when extracting plant tissues. Analytical Biochemistry 9: 431–442. - PubMed
-
- BrzobohatyB, Moore I, Kristoffersen P, Bako L, Campos N, Schell J, Palme K.1993. Release of active cytokinin by a β‐glucosidase localized to the maize root meristem. Science 262: 1051–1054. - PubMed
-
- BrzobohatyB, Moore I, Palme K.1994. Cytokinin metabolism: implications for regulation of plant growth and development. Plant Molecular Biology 26: 1483–1497. - PubMed
Publication types
MeSH terms
Substances
LinkOut - more resources
Full Text Sources
Research Materials
