. 2003 Apr;72(4):850-68.
doi: 10.1086/373966. Epub 2003 Mar 19.

Genome association studies of complex diseases by case-control designs

Affiliations

Genome association studies of complex diseases by case-control designs

Ruzong Fan et al. Am J Hum Genet. 2003 Apr.

Abstract

One way to perform linkage-disequilibrium (LD) mapping of genetic traits is to use single markers. Since dense marker maps-such as single-nucleotide polymorphism and high-resolution microsatellite maps-are available, it is natural and practical to generalize single-marker LD mapping to high-resolution haplotype or multiple-marker LD mapping. This article investigates high-resolution LD-mapping methods, for complex diseases, based on haplotype maps or microsatellite marker maps. The objective is to explore test statistics that combine information from haplotype blocks or multiple markers. Based on two coding methods, genotype coding and haplotype coding, Hotelling's T2 statistics TG and TH are proposed to test the association between a disease locus and two haplotype blocks or two markers. The validity of the two T2 statistics is proved by theoretical calculations. A statistic TC, an extension of the traditional chi2 method of comparing haplotype frequencies, is introduced by simply adding the chi2 test statistics of the two haplotype blocks together. The merit of the three methods is explored by calculation and comparison of power and of type I errors. In the presence of LD between the two blocks, the type I error of TC is higher than that of TH and TG, since TC ignores the correlation between the two blocks. For each of the three statistics, the power of using two haplotype blocks is higher than that of using only one haplotype block. By power comparison, we notice that TC has higher power than that of TH, and TH has higher power than that of TG. In the absence of LD between the two blocks, the power of TC is similar to that of TH and higher than that of TG. Hence, we advocate use of TH in the data analysis. In the presence of LD between the two blocks, TH takes into account the correlation between the two haplotype blocks and has a lower type I error and higher power than TG. Besides, the feasibility of the methods is shown by sample-size calculation.


Figures
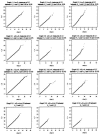
Figure  1
Figure 1
QQ plot at significance level α=0.01 using two haplotype blocks H1, l=2, and H2. In graphs I.1, I.2, and I.3, all parameters are the same as those of model I in table 2. In graphs II.1, II.2, and II.3, all parameters are the same as those of model II in table 2. In graphs III.1, III.2, and III.3, all parameters are the same as those of model III in table 2. In graphs IV.1, IV.2, and IV.3, all parameters are the same as those of model IV in table 2.
Figure  2
Figure 2
Power curves of TC, TH, TG, TC2, TH2, and TG2 at significance level α=0.01, using two haplotype blocks H1, l=2, and H2, r=2, when P(H11)=P(H12)=P(H21)=P(H22)=0.50, ΔH11H21=P(H11H21)-P(H11)P(H21)=0.075, ΔH11H22=P(H11H22)-P(H11)P(H22)=-0.075, PD=0.30, N=M=500, T=50, for the four genetic models in table 4.
Figure  3
Figure 3
Power curves of TC, TH, TG, TC2, TH2, and TG2 at significance level α=0.01, using two haplotype blocks H1, l=2, and H2, r=3, when P(H11)=P(H12)=0.5, P(H21)=0.4, P(H22)=P(H23)=0.30, ΔH11H21=P(H11H21)-P(H11)P(H21)=0.075, ΔH11H22=P(H11H22)-P(H11)P(H22)=-0.0375, ΔH11H23=P(H11H23)-P(H11)P(H23)=-0.0375, PD=0.30,N=M=500,T=50, for the four genetic models in table 4.
Figure  4
Figure 4
Power curves of TC, TH, TG, TC2, TH2, and TG2 at significance level α=0.01 using two haplotype blocks H1, l=2, and H2, r=4, when P(H11)=P(H12)=0.5,P(H21)=P(H22)=P(H23)=P(H24)=0.25, ΔH11H21=P(H11H21)-P(H11)P(H21)=0.075, ΔH11H22=P(H11H22)-P(H11)P(H22)=0.075, ΔH11H23=P(H11H23)-P(H11)P(H23)=-0.075, ΔH11H24=P(H11H24)-P(H11)P(H24)=-0.075, PD=0.30, N=M=500, T=50, for the four genetic models in table 4.
Figure  5
Figure 5
Power curves of TC, TH, and TG at significance level α=0.01 using two haplotype blocks H1, l=2, and H2, r=4, when P(H11)=P(H12)=0.5,P(H21)=P(H22)=P(H23)=P(H24)=0.25, ΔH11H21=P(H11H21)-P(H11)P(H21)=0.0, ΔH11H22=P(H11H22)-P(H11)P(H22)=0.0, ΔH11H23=P(H11H23)-P(H11)P(H23)=0.0, ΔH11H24=P(H11H24)-P(H11)P(H24)=0.0, PD=0.30, N=M=500, T=50, for the four genetic models in table 4.
Figure  6
Figure 6
Power curves of TH for different mutation ages at significance level α=0.01, using two haplotype blocks H1, l=2, and H2, r=4, when P(H11)=P(H12)=0.5, P(H21)=P(H22)=P(H23)=P(H24)=0.25, ΔH11H21=P(H11H21)-P(H11)P(H21)=0.075, ΔH11H22=P(H11H22)-P(H11)P(H22)=0.075, ΔH11H23=P(H11H23)-P(H11)P(H23)=-0.075, ΔH11H24=P(H11H24)-P(H11)P(H24)=-0.075, PD=0.30, N=M=500, for the four genetic models in table 4.
Figure  7
Figure 7
Power curves of TH for different disease frequency at significance level α=0.01, using two haplotype blocks H1, l=2, and H2, r=4, when P(H11)=P(H12)=0.5, P(H21)=P(H22)=P(H23)=P(H24)=0.25, ΔH11H21=P(H11H21)-P(H11)P(H21)=0.075, ΔH11H22=P(H11H22)-P(H11)P(H22)=0.075, ΔH11H23=P(H11H23)-P(H11)P(H23)=-0.075, ΔH11H24=P(H11H24)-P(H11)P(H24)=-0.075, T=50, N=M=500, for the four genetic models in table 4.

References

Electronic-Database Information

    1. R.F.'s Web site, http://stat.tamu.edu/~rfan/paper.html/case_control_Figs_supplement.pdf and http://stat.tamu.edu/~rfan/paper.html/case_control_powsim.pdf (for supplementary information)

References

    1. Akey J, Jin L, Xiong MM (2001) Haplotype vs. single marker linkage disequilibrium tests: what do we gain? Eur J Hum Genet 9:291–300 - PubMed
    1. Anderson TW (1984) An introduction to multivariate statistical analysis, 2nd edition. John Wiley and Sons, New York
    1. Ardlie KG, Lunetta KL, Seielstad M (2002) Testing for population subdivision and association in four case-control studies. Am J Hum Genet 71:304–311 - PMC - PubMed
    1. Broman KW, Murray JC, Sheffied VC, White RL, Weber JL (1998) Comprehensive human genetic map: individual and sex-specific variation in recombination. Am J Hum Genet 63:861–869 - PMC - PubMed
    1. Chapman NH, Wijsman EM (1998) Genome screens using linkage disequilibrium tests: optimal marker characteristics and feasibility. Am J Hum Genet 63:1872–1885 - PMC - PubMed

Publication types