. 2003 Apr;162(4):1123-37.
doi: 10.1016/S0002-9440(10)63909-0.

RAGE drives the development of glomerulosclerosis and implicates podocyte activation in the pathogenesis of diabetic nephropathy

Affiliations

RAGE drives the development of glomerulosclerosis and implicates podocyte activation in the pathogenesis of diabetic nephropathy

Thoralf M Wendt et al. Am J Pathol. 2003 Apr.

Abstract

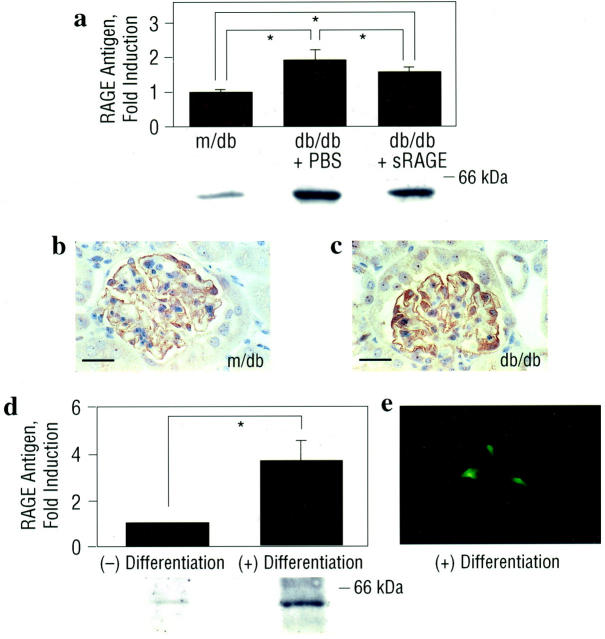
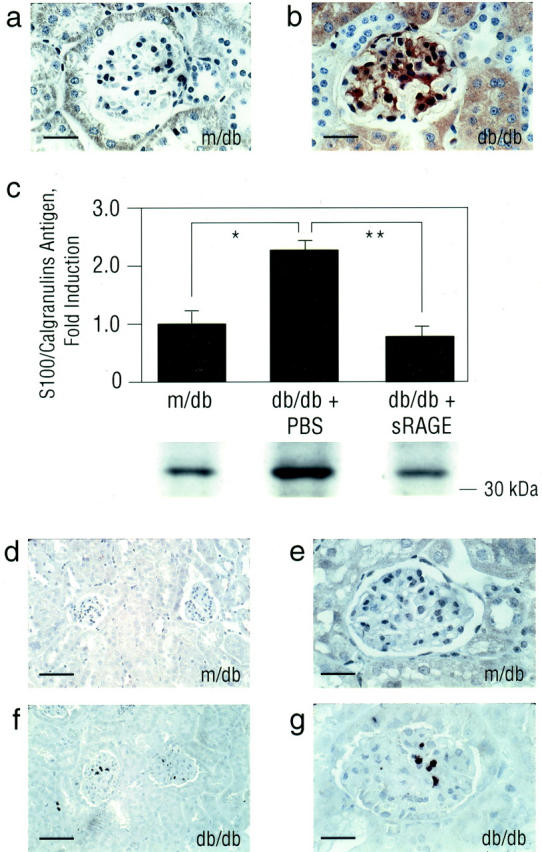
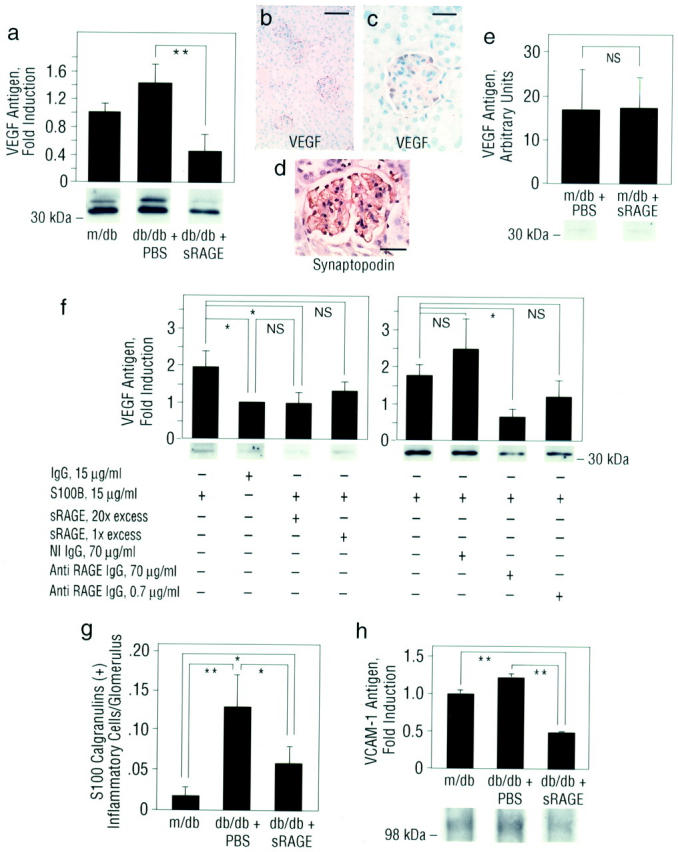
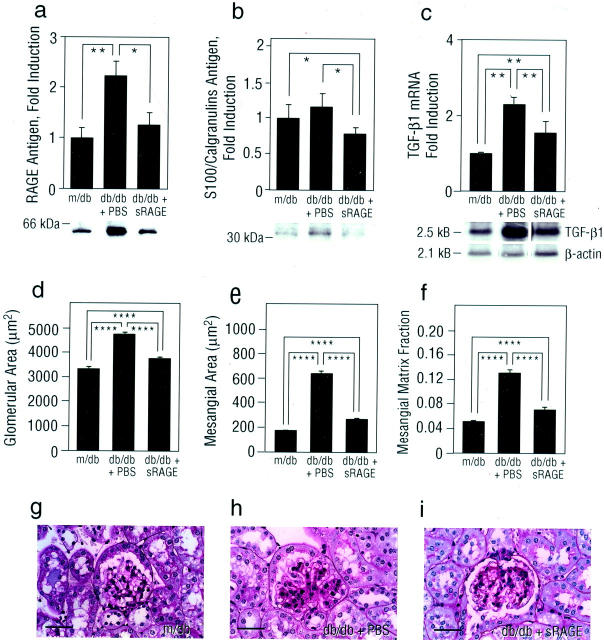
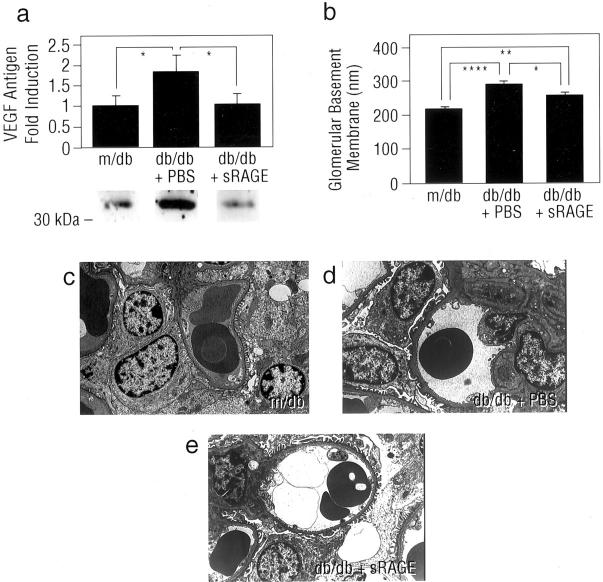
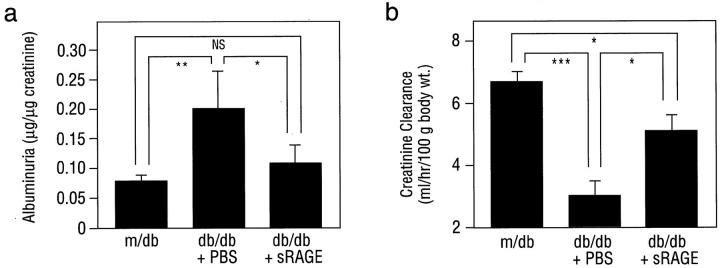
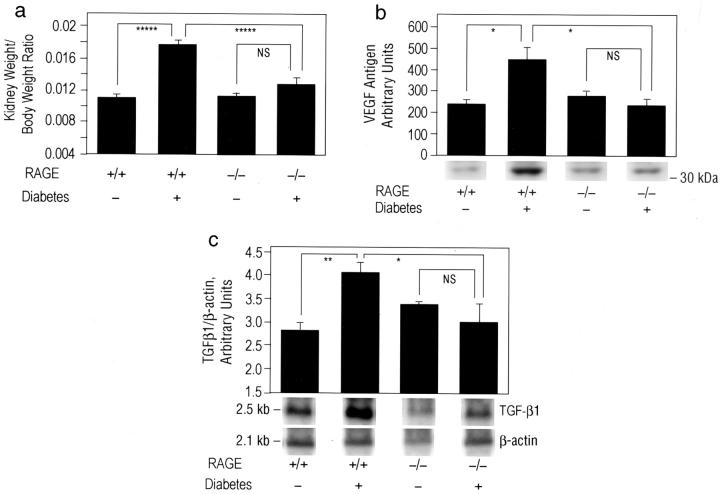
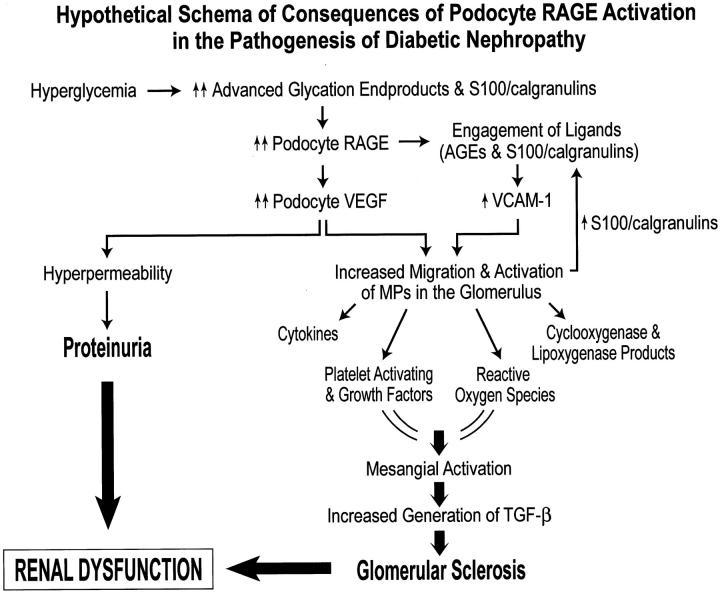
Diabetic nephropathy ensues from events involving earliest changes in the glomeruli and podocytes, followed by accumulation of extracellular matrix in the mesangium. Postulated mechanisms include roles for vascular endothelial growth factor (VEGF), produced by podocytes and contributing to enhanced excretion of urinary albumin and recruitment/activation of inflammatory cells, and transforming growth factor-beta (TGF-beta), elicited largely from mesangial cells and driving production of extracellular matrix. RAGE, a receptor for advanced glycation endproducts (AGEs) and S100/calgranulins, displays enhanced expression in podocytes of genetically diabetic db/db mice by age 13 weeks. RAGE-bearing podocytes express high levels of VEGF by this time, in parallel with enhanced recruitment of mononuclear phagocytes to the glomeruli; events prevented by blockade of RAGE. By age 27 weeks, soluble RAGE-treated db/db mice displayed diminished albuminuria and glomerulosclerosis, and improved renal function. Diabetic homozygous RAGE null mice failed to develop significantly increased mesangial matrix expansion or thickening of the glomerular basement membrane. We propose that activation of RAGE contributes to expression of VEGF and enhanced attraction/activation of inflammatory cells in the diabetic glomerulus, thereby setting the stage for mesangial activation and TGF-beta production; processes which converge to cause albuminuria and glomerulosclerosis.


Figures

Figure 1.
Figure 1.
Expression of RAGE antigen is enhanced in db/db kidney and localizes to the podocyte at age 13 weeks. a: Immunoblotting. Male control (m/db) and diabetic (db/db) mice were studied. At age 8 weeks, db/db mice were treated once daily with murine sRAGE (50 μg) by intraperitoneal route, or with equal volumes of PBS. Mice were sacrificed at age 13 weeks and renal cortical tissue retrieved for SDS/PAGE and immunoblotting with rabbit anti-RAGE IgG. The approximate Mr of standard molecular weight markers is shown. *, P < 0.05. b and c: Immunohistochemistry. Renal cortical tissue was subjected to immunohistochemistry using anti-RAGE IgG. RAGE antigen was principally expressed in the podocyte as confirmed by co-localization using anti-synaptopodin IgG (not shown). The illustrated immunostaining is representative of n = 5 mice/condition. Bar, 16 μm. d and e: In vitro studies of podocyte RAGE. d: Immunoblotting. Cultured murine podocytes were grown under conditions for propagation vs. differentiation. Cells were harvested and subjected to SDS/PAGE and immunoblotting with anti-RAGE IgG. The approximate Mr of standard molecular weight markers is shown. *, P < 0.05. e: Immunohistochemistry. Cultured murine podocytes, under differentiating conditions, were subjected to immunostaining with anti-RAGE IgG. Part e displays a single differentiated cultured murine podocyte with arborized processes; RAGE antigen appears to be localized to the peripheral processes. In both a and d, representative bands from each condition are shown; immunoblots from n = 3 mice or n = 3 experiments per condition were performed. Mean ± SE of densitometric analysis is reported.
Figure 2.
Figure 2.
Expression of CML epitopes and S100/calgranulins is enhanced in db/db kidney at age 13 weeks. a and b: Immunohistochemistry. Renal tissue from m/db or db/db mice at age 13 weeks was subjected to immunohistochemistry using affinity-purified anti-CML IgG. Bar, 16 μm. c: Immunoblotting. M/db and PBS- vs. sRAGE-treated db/db mice were sacrificed at age 13 weeks and renal cortical tissue retrieved for SDS/PAGE and immunoblotting using rabbit anti-S100/calgranulin IgG. The approximate Mr of standard molecular weight markers is shown. Representative bands from each condition are shown; immunoblots from n = 3 mice per condition were performed. Densitometric analysis is indicated, and mean ± SE is reported. *, P < 0.05; and **, P < 0.01. d–g: Immunohistochemistry. Renal tissue from m/db or db/db mice was subjected to immunohistochemistry using anti-S100/calgranulin IgG. S100/calgranulins were principally expressed in mononuclear phagocytes infiltrating the glomerulus/interstitium as confirmed by co-localization studies using anti-Mac 3 IgG (not shown). Bar; d and f, 40 μm; and bar; e and g, 16 μm. In a, b, d, e, f, and g, immunostaining is representative of n = 7 mice/condition.
Figure 3.
Figure 3.
Expression of VEGF and VCAM-1 antigens is enhanced in db/db kidney at age 13 weeks: prevention by blockade of RAGE. a, e, and h: Immunoblotting. Control m/db and db/db mice were sacrificed at age 13 weeks and renal cortical tissue retrieved for SDS/PAGE and immunoblotting using anti-murine VEGF IgG (a and e) or anti-murine VCAM-1 IgG (h). The approximate Mr of standard molecular weight markers is shown. Representative bands from each condition are shown; immunoblots from n = 3 mice per condition were performed. Densitometric analysis is indicated, and mean ± SE is reported. **, P < 0.01. b–d: Immunohistochemistry. Renal cortical tissue from db/db mice was subjected to immunohistochemistry using anti-murine VEGF IgG. VEGF antigen (b and c) was specifically expressed in the podocytes as confirmed by co-localization using anti-synaptopodin IgG (d). The illustrated immunostaining is representative of n = 3 mice/condition. Bar: b, 40 μm; c and d, 15 μm. f: Cultured podocytes. Differentiated cultured murine podocytes were exposed to irrelevant IgG or S100B (15 μg/ml) for 6 hours. Where indicated, S100B was preincubated with molar excesses of sRAGE (20- or onefold) for 2 hours, or podocytes were preincubated with anti-RAGE IgG or nonimmune IgG (70 or 0.7 μg/ml) for 2 hours before addition of S100B. Cells were lysed and SDS/PAGE and immunoblotting performed using anti-VEGF IgG. The approximate Mr of standard molecular weight markers is shown. These experiments were performed at least three times; *, P < 0.05. g: Immunohistochemistry and quantification of infiltrating inflammatory cells. The mean number of S100/calgranulin-expressing inflammatory cells ± SE infiltrating the glomeruli in randomly chosen 30 glomeruli per condition (n = 3 to 4 mice/condition) is reported. Co-localization studies using anti-Mac 3 IgG indicated that the infiltrating cells were MPs (not shown). *, P < 0.05; and **, P < 0.01.
Figure 4.
Figure 4.
Expression of RAGE and S100/calgranulin antigens, and mRNA for TGF-β1 is enhanced in db/db kidney at age 27 weeks: suppression by blockade of RAGE. a and b: Immunoblotting. Renal cortical tissue was retrieved from m/db or PBS- vs. sRAGE-treated db/db mice at age 27 weeks. SDS/PAGE and immunoblotting were performed using rabbit anti-RAGE IgG (a) or anti-S100/calgranulin IgG (b). The approximate Mr of standard molecular weight markers is shown. Representative bands from each condition are shown; in a, immunoblots from n = 6 mice per condition were performed, and in b, n = 3 mice/condition were used. Densitometric analysis is indicated, and mean ± SE is reported. *, P < 0.05, and **, P < 0.01. c: Northern blotting. At age 27 weeks, renal cortical tissue was retrieved from the indicated mice and Northern blotting using labeled probes to either TGF-β1 or β-actin performed. Representative bands from n = 3 mice per condition are shown. Densitometric analysis is indicated, and mean ± SE is reported. **, P < 0.01. d–i: Morphometric analysis. Glomeruli were examined from PAS-stained sections (g, h, and i) and morphometric analysis performed for glomerular area (d), mesangial area (e), and mesangial matrix fraction (f). Numbers of mice per condition were: 3 m/db, 5 db/db + PBS, and 4 db/db + sRAGE. Mean ± SE is reported. ****, P < 0.0001. In g, a representative PAS-stained section from a non-diabetic m/db mouse is shown; in h and i, representative PAS-stained sections from db/db mice treated with PBS vs. sRAGE, respectively, is displayed. Note that PAS-positive material in PBS-treated db/db mice exceeds that seen in m/db mice and in sRAGE-treated db/db animals of the same age. Bar, 25 μm.
Figure 5.
Figure 5.
Levels of VEGF antigen and GBM thickness are enhanced in db/db kidney at age 27 weeks: suppression by blockade of RAGE. a: Immunoblotting. At age 27 weeks, renal cortical tissue was retrieved from the indicated mice and immunoblotting performed using anti-VEGF IgG. Representative bands from n = 3 mice per condition are shown. Densitometric analysis is indicated, and mean ± SE is reported. *, P < 0.05. b–e: GBM thickness. At age 27 weeks, kidneys were retrieved from the indicated mice and electron microscopy performed for measurement of GBM thickness (c, d, and e). N = 6 to 7 mice/condition. The mean ± SE is reported. *, P < 0.05, **, P < 0.01; and ****, P < 0.0001. In d, note that the thickness of the GBM in PBS-treated db/db mice exceeds that observed in either non-diabetic m/db mice (c) or sRAGE-treated db/db mice of the same age (e). Magnification, ×5000.
Figure 6.
Figure 6.
Renal function is diminished in db/db mice at 27 weeks: prevention by blockade of RAGE. At age 27 weeks, mice were placed in metabolic cages and urine/serum collected. Albuminuria (a) and creatinine clearance (b) were determined. In both a and b, n = 5 mice/condition. The mean ± SE is reported. *, P < 0.05, **, P < 0.01, and ***, P < 0.001.
Figure 7.
Figure 7.
Diabetic RAGE null mice do not display increased VEGF antigen or mRNA for TGF-β in the renal cortex. a: Kidney weight. Diabetes (or control) was induced in RAGE null mice (129/B6) and strain-matched controls. The numbers of mice used for these studies were as follows: 8 RAGE null (without diabetes), 9 RAGE null (with diabetes), 14 strain-matched control (without diabetes), and 13 strain-matched control (with diabetes). After 12 weeks of diabetes, mice were sacrificed. Kidney weight/body weight ratio is reported. *****, P < 0.00001. b: VEGF antigen. At sacrifice, renal cortical tissue was prepared from the indicated mice and immunoblotting performed using anti-VEGF IgG. *, P < 0.05. c: Northern blotting. Renal cortical tissue was prepared from RAGE null mice and strain-matched controls using labeled probes to TGF-β or β-actin; *, P < 0.05 and **, P < 0.01. In b and c, representative bands from n = 3 mice per condition are shown. Densitometric analysis is indicated, and mean ± SE is reported.
Figure 8.
Figure 8.
Hypothetical schema of consequences of podocyte RAGE activation in the pathogenesis of diabetic nephropathy. We hypothesize that in hyperglycemia, accelerated generation of ligands of RAGE, AGEs, and S100/calgranulins, leads to up-regulation of podocyte RAGE; an important consequence of which is increased expression/activity of VEGF. Increased VEGF activity leads to both hyperpermeability and proteinuria, as well as attraction and activation of MP within the diabetic glomerulus. In addition, engagement of podocyte RAGE by its ligands further leads to increased expression of VCAM-1. We propose that increased expression of VEGF and VCAM-1 leads to increased migration and activation of MPs within the glomerulus. Activated MP may then release a range of mediators and species linked to mesangial activation; a critical consequence of which is enhanced generation of TGF-β, culminating in glomerular sclerosis. In addition, activated MP may release further S100/calgranulins, thereby setting up a chronic cascade of ligand up-regulation and receptor activation. Taken together, we propose that RAGE-mediated proteinuria and glomerular sclerosis contribute to diabetes-associated renal dysfunction.

References

    1. Ritz E, Rychilik I, Locatelli F, Halimi S: End-stage renal failure in type 2 diabetes: a medical catastrophe of worldwide dimension. Am J Kidney Dis 1999, 34:795-808 - PubMed
    1. Koch M, Kutkuhn B, Grabensee B, Ritz E: Apolipoprotein A, fibrinogen, age, and history of stroke are predictors of death in dialyzed diabetic subjects: prospective study of 412 subjects. Nephrol Dial Transplant 1997, 12:2603-2611 - PubMed
    1. Yamamoto T, Nakamura T, Noble NA, Ruoslahti E, Border WA: Expression of transforming growth factor β is elevated in human and experimental diabetic nephropathy. Proc Natl Acad Sci USA 1993, 90:1814-1818 - PMC - PubMed
    1. Border WA, Noble NA: Transforming growth factor β in tissue fibrosis. N Engl J Med 1994, 331:1286-1292 - PubMed
    1. Wolf G, Hamann A, Han DC, Helmchen U, Thaiss F, Ziyadeh FN, Stahl RA: Leptin stimulates proliferation and TGF-β expression in renal glomerular endothelial cells: potential role in glomerulosclerosis. Kidney Int 1999, 56:860-872 - PubMed

Publication types

Substances