Potential interaction between CCR1 and its ligand, CCL3, induced by endogenously produced interleukin-1 in human hepatomas
- PMID: 12651617
- PMCID: PMC1851222
- DOI: 10.1016/S0002-9440(10)63921-1
Potential interaction between CCR1 and its ligand, CCL3, induced by endogenously produced interleukin-1 in human hepatomas
Abstract
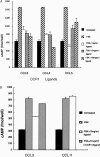
Hepatoma cell lines can produce a massive amount of chemokines in response to various stimuli including hepatitis viruses and their products. However, it remains elusive on the types of chemokine receptor(s) expressed in the hepatoma tissues and its roles in hepatoma development. To clarify these points, we examined the chemokine receptor expression in six human hepatoma cell lines. All of the hepatoma cell lines constitutively and exclusively expressed CCR1 mRNA and its protein on their cell surface. CCR1 expression was also detected on hepatoma cells and to a lesser degree, on endothelial cells in hepatoma tissues but not in normal liver tissues. Furthermore, CCL3 expression was detected in hepatoma cells, endothelial cells, and to a lesser degree, fibroblast-like cells in hepatoma tissue, whereas only occasional vascular endothelial cells and inflammatory cells in normal liver tissues were weakly positive for CCL3. Moreover, the forskolin-mediated increases in intracellular cAMP concentrations were inhibited by the ligands for CCR1, CCL3, CCL4, and CCL5, suggesting that the expressed CCR1 was functional. Four hepatoma cell lines produced CCL3 only in response to interleukin (IL)-1 alpha and IL-1 beta. Finally, IL-1 alpha and IL-1 beta were detected abundantly in hepatoma tissues but not in normal liver tissues. Thus, IL-1 may enhance the local production of CCL3, which may interact with CCR1 expressed on hepatoma cells, in an autocrine and/or paracrine manner.
Figures


Similar articles
-
CCR1 chemokines promote the chemotactic recruitment, RANKL development, and motility of osteoclasts and are induced by inflammatory cytokines in osteoblasts.J Bone Miner Res. 2004 Dec;19(12):2065-77. doi: 10.1359/JBMR.040910. Epub 2004 Sep 20. J Bone Miner Res. 2004. PMID: 15537451
-
Role of C-C chemokine receptors 1 and 5 and CCL3/macrophage inflammatory protein-1alpha in the cutaneous Arthus reaction: possible attenuation of their inhibitory effects by compensatory chemokine production.Eur J Immunol. 2004 Dec;34(12):3553-61. doi: 10.1002/eji.200425426. Eur J Immunol. 2004. PMID: 15517609
-
Essential contribution of a chemokine, CCL3, and its receptor, CCR1, to hepatocellular carcinoma progression.Int J Cancer. 2006 Apr 15;118(8):1869-76. doi: 10.1002/ijc.21596. Int J Cancer. 2006. PMID: 16284949
-
Developmental changes in the expression of chemokine receptor CCR1 in the rat cerebellum.J Comp Neurol. 2003 Feb 24;457(1):7-23. doi: 10.1002/cne.10554. J Comp Neurol. 2003. PMID: 12541321
-
Complex analysis of genes involved in the inflammatory response: interleukin-1-induced differential transcriptome of cultured human hepatoma HepG2 cells.Acta Biochim Pol. 2003;50(3):573-82. Acta Biochim Pol. 2003. PMID: 14515140 Review.
Cited by
-
Control of both myeloid cell infiltration and angiogenesis by CCR1 promotes liver cancer metastasis development in mice.Neoplasia. 2013 Jun;15(6):641-8. doi: 10.1593/neo.121866. Neoplasia. 2013. PMID: 23730212 Free PMC article.
-
Serum levels of chemokines CCL4 and CCL5 in cirrhotic patients indicate the presence of hepatocellular carcinoma.Br J Cancer. 2015 Sep 1;113(5):756-62. doi: 10.1038/bjc.2015.227. Epub 2015 Aug 13. Br J Cancer. 2015. PMID: 26270232 Free PMC article.
-
The inflammatory response in acyl-CoA oxidase 1 deficiency (pseudoneonatal adrenoleukodystrophy).Endocrinology. 2012 Jun;153(6):2568-75. doi: 10.1210/en.2012-1137. Epub 2012 Apr 16. Endocrinology. 2012. PMID: 22508517 Free PMC article.
-
Chemokines in tumor progression and metastasis.Oncotarget. 2013 Dec;4(12):2171-85. doi: 10.18632/oncotarget.1426. Oncotarget. 2013. PMID: 24259307 Free PMC article. Review.
-
Relevance of CCL3/CCR5 axis in oral carcinogenesis.Oncotarget. 2017 Apr 6;8(31):51024-51036. doi: 10.18632/oncotarget.16882. eCollection 2017 Aug 1. Oncotarget. 2017. PMID: 28881626 Free PMC article.
References
-
- Premack BA, Schall TJ: Chemokine receptors: gateways to inflammation and infection. Nat Med 1996, 2:1174-1178 - PubMed
-
- Rollins BJ: Chemokines. Blood 1997, 90:909-928 - PubMed
-
- Rossi D, Zlotnik A: The biology of chemokines and their receptors. Annu Rev Immunol 2000, 18:217-242 - PubMed
-
- Mellado M, Rodriguez-Frade JM, Manes S, Martinez AC: Chemokine signaling and functional responses: the role of receptor dimerization and TK pathway activation. Annu Rev Immunol 2001, 19:397-421 - PubMed
-
- Gerard C, Rollins BJ: Chemokines and disease. Nat Immunol 2001, 2:108-115 - PubMed
Publication types
MeSH terms
Substances
LinkOut - more resources
Full Text Sources
Other Literature Sources
Medical

