Clonal tracking of autoaggressive T cells in polymyositis by combining laser microdissection, single-cell PCR, and CDR3-spectratype analysis
- PMID: 12651958
- PMCID: PMC153053
- DOI: 10.1073/pnas.0236183100
Clonal tracking of autoaggressive T cells in polymyositis by combining laser microdissection, single-cell PCR, and CDR3-spectratype analysis
Abstract
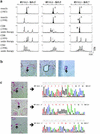
Clonal expansions of CD8+ T cells have been identified in muscle and blood of polymyositis patients by PCR techniques, including T cell receptor (TCR) complementarity-determining region (CDR)3 length analysis (spectratyping). To examine a possible pathogenic role of these clonally expanded T cells, we combined CDR3 spectratyping with laser microdissection and single-cell PCR of individual myocytotoxic T cells that contact, invade, and destroy a skeletal muscle fiber. First, we screened cDNA from muscle biopsy specimens by CDR3 spectratyping for expanded TCR beta chain variable region (BV) sequences. To pinpoint the corresponding T cells in tissue, we stained cryostat sections with appropriate anti-TCR BV mAbs, isolated single BV+ T cells that directly contacted or invaded a muscle fiber by laser-assisted microdissection, and amplified their TCR BV chain sequences from rearranged genomic DNA. In this way, we could relate the oligoclonal peaks identified by CDR3-spectratype screening to morphologically characterized microdissected T cells. In one patient, a large fraction of the microdissected T cells carried a common TCR-BV amino acid CDR3 motif and conservative nucleotide exchanges in the CDR3 region, suggesting an antigen-driven response. In several cases, we tracked these T cell clones for several years in CD8+ (but not CD4+) blood lymphocytes and in two patients also in consecutive muscle biopsy specimens. During immunosuppressive therapy, oligoclonal CDR3-spectratype patterns tended to revert to more polyclonal Gaussian distribution-like patterns. Our findings demonstrate that CDR3 spectratyping and single-cell analysis can be combined to identify and track autoaggressive T cell clones in blood and target tissue. This approach should be applicable to other inflammatory and autoimmune disorders.
Figures

References
-
- Pannetier C, Even J, Kourilsky P. Immunol Today. 1995;16:176–181. - PubMed
-
- Hingorani R, Choi I-H, Akolkar P, Gulwani-Akolkar B, Pergolizzi R, Silver J, Gregersen P K. J Immunol. 1993;151:5762–5769. - PubMed
-
- Schwab R, Szabo P, Manavalan J S, Weksler M E, Posnett D N, Pannetier C, Kourilsky P, Even J. J Immunol. 1997;158:4493–4499. - PubMed
-
- Chamberlain W D, Falta M T, Kotzin B L. Clin Immunol. 2000;94:160–172. - PubMed
Publication types
MeSH terms
Substances
LinkOut - more resources
Full Text Sources
Other Literature Sources
Research Materials

