Review
. 2002:Suppl 35:131-58.
doi: 10.1002/ajpa.10182.

Canalization, developmental stability, and morphological integration in primate limbs

Affiliations
Review

Canalization, developmental stability, and morphological integration in primate limbs

Benedikt Hallgrímsson et al. Am J Phys Anthropol. 2002.

Abstract

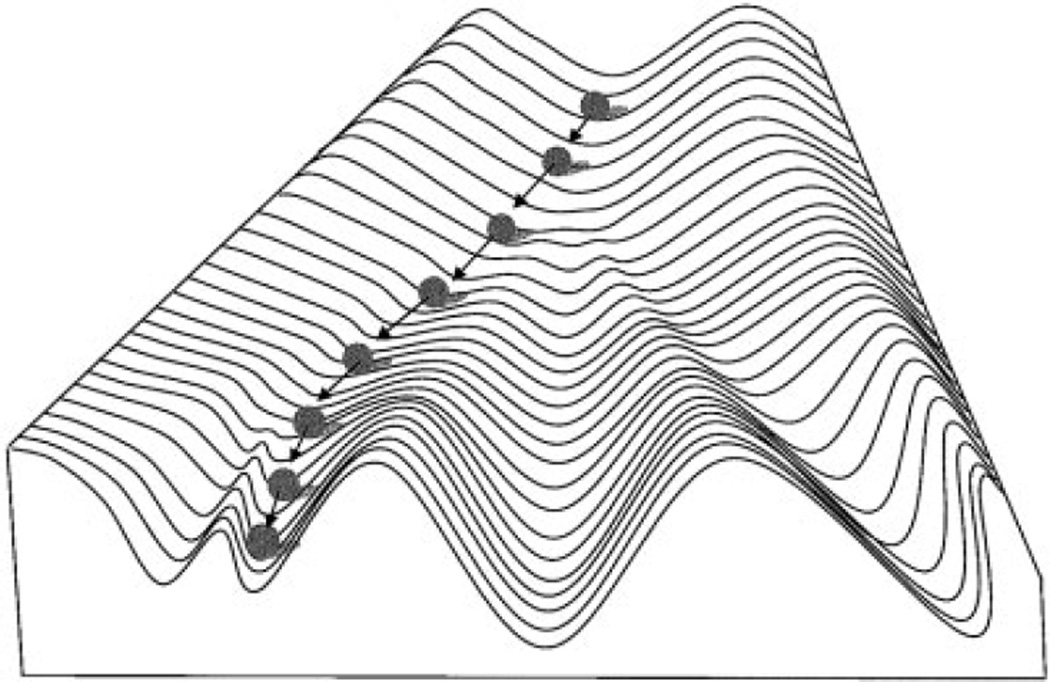
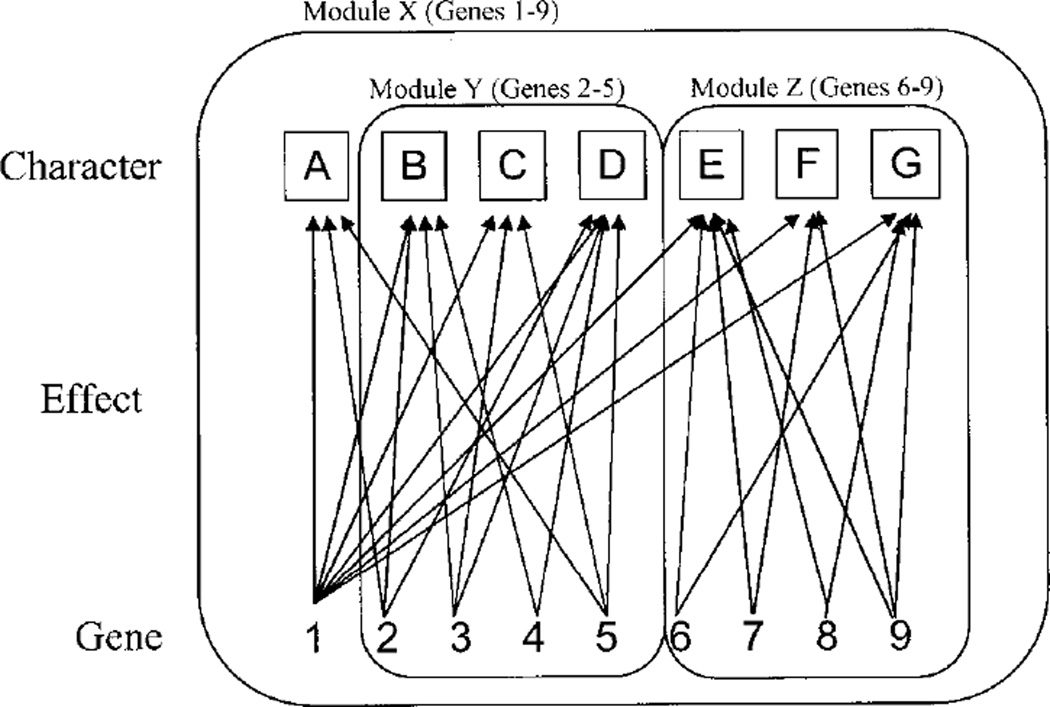
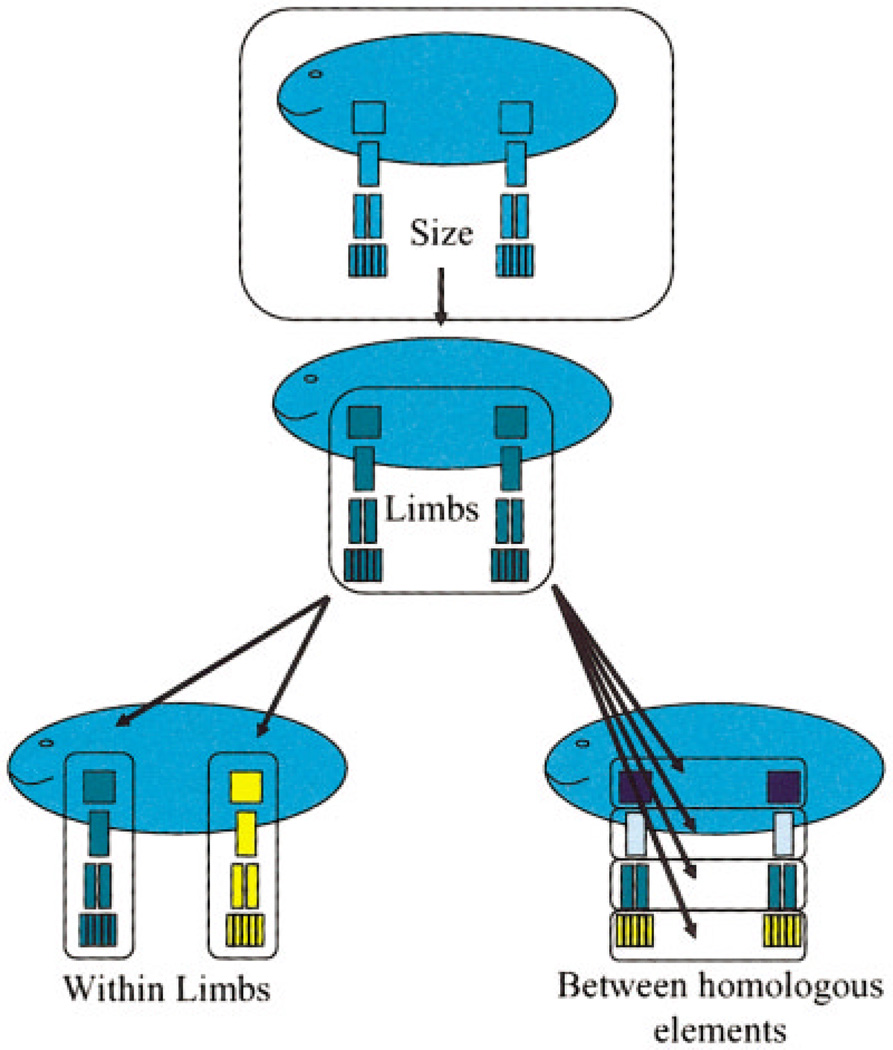
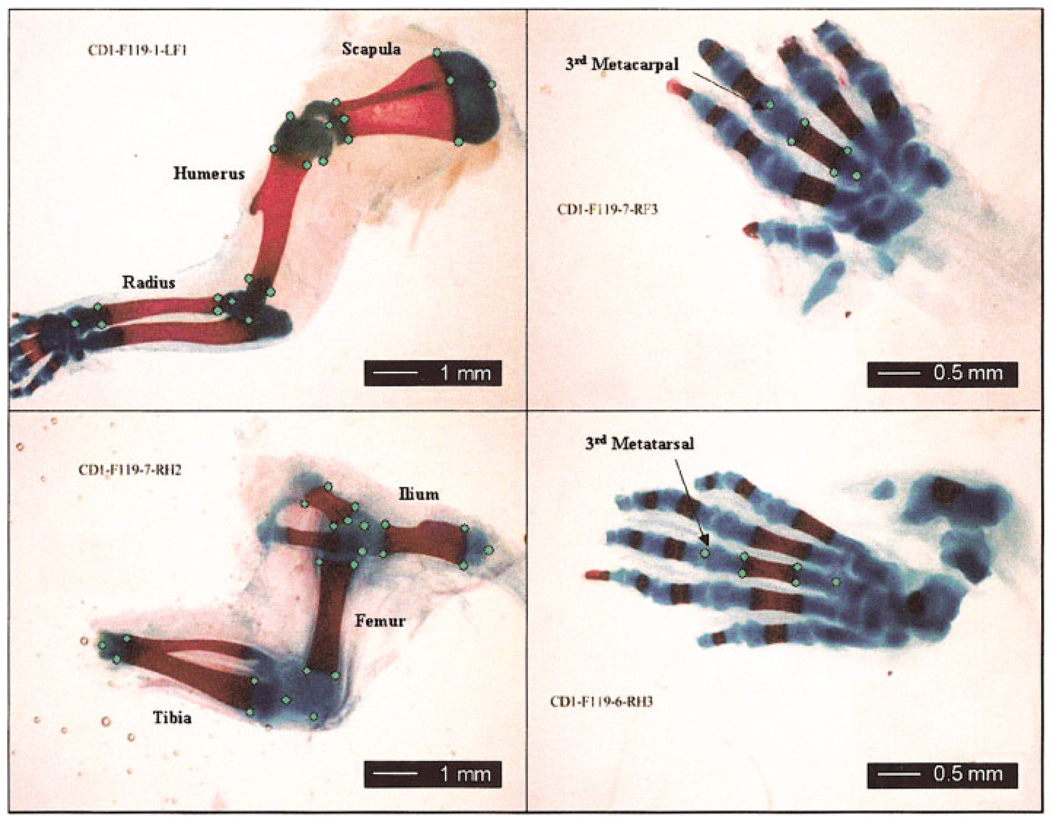
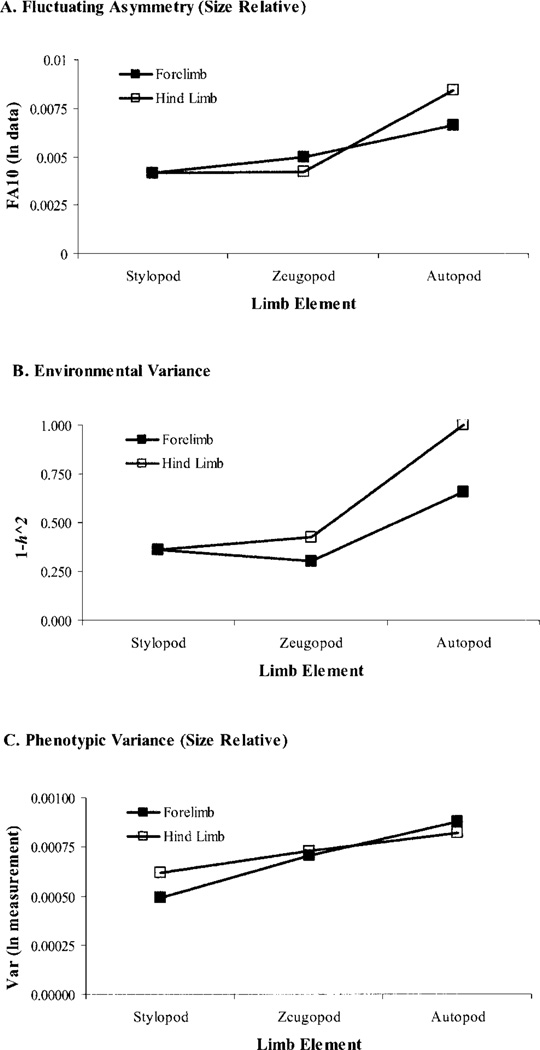
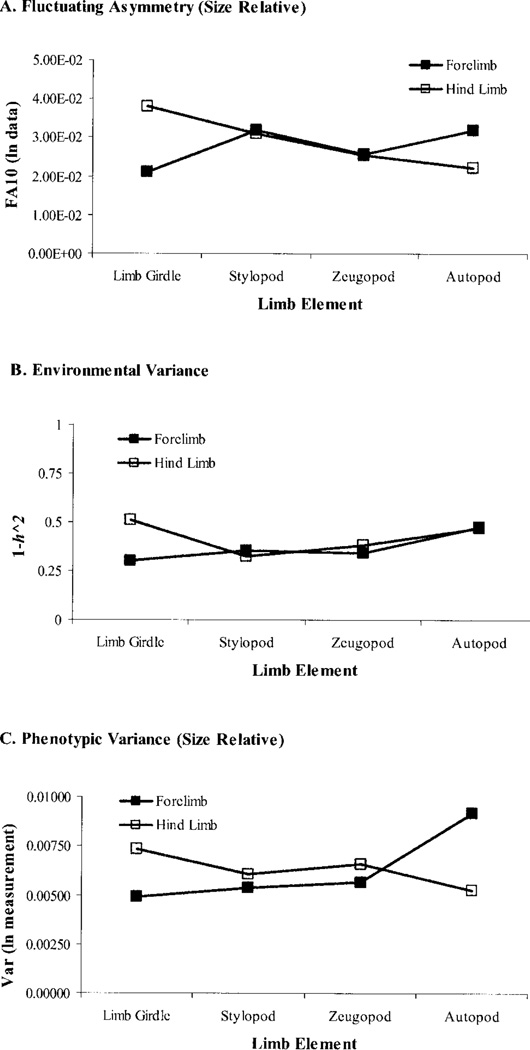
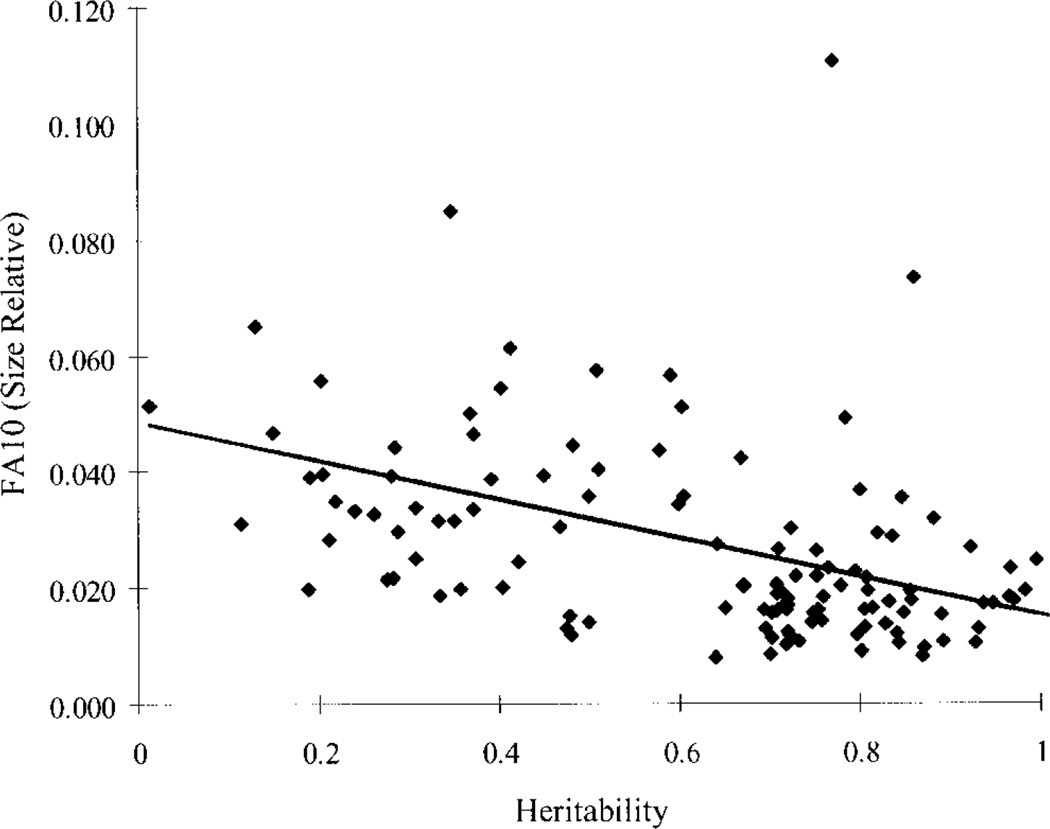
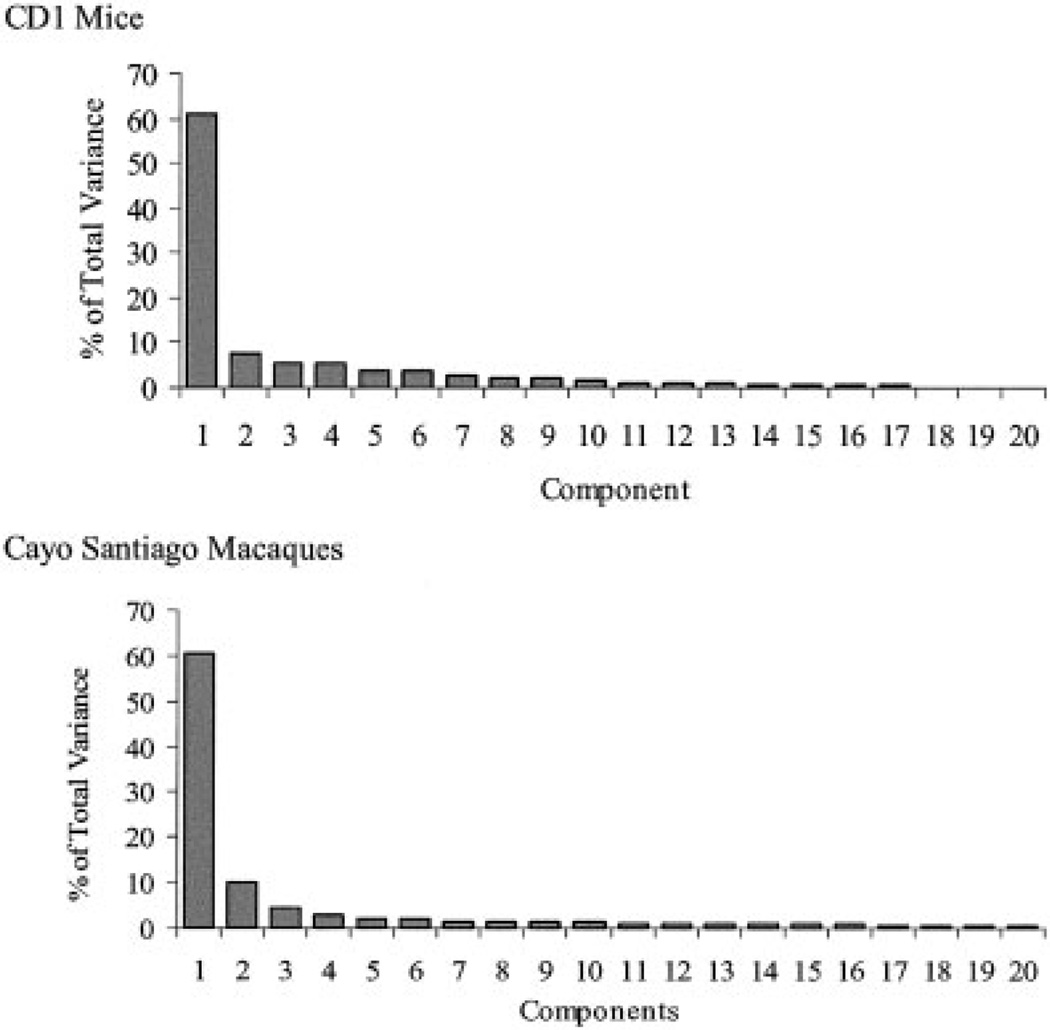
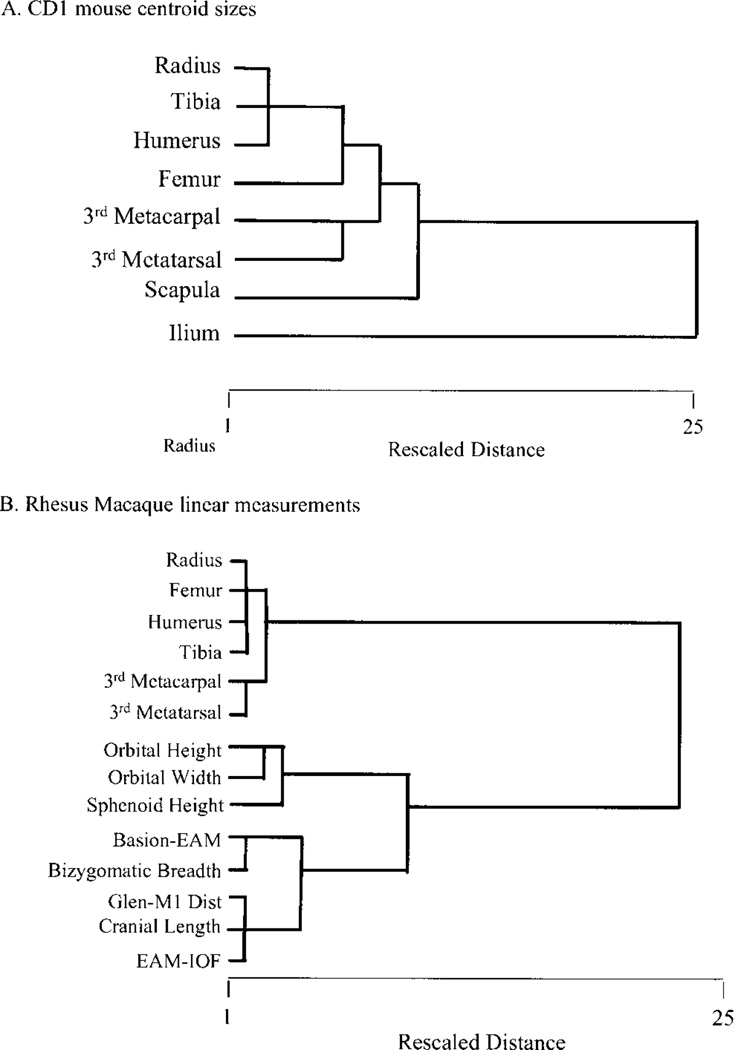
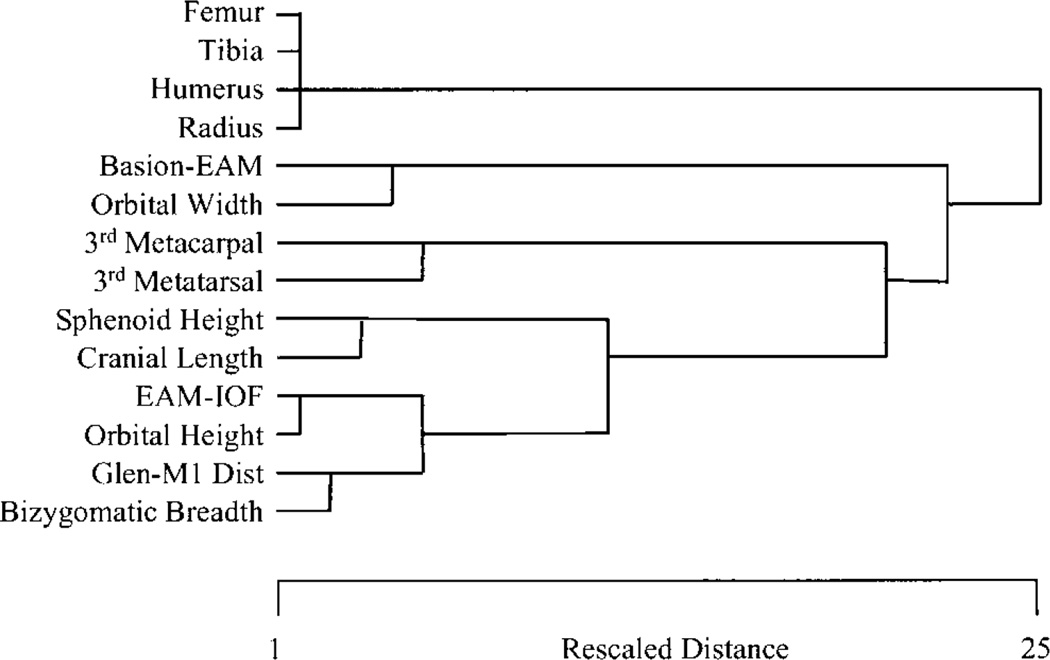
Canalization and developmental stability refer to the tendency of developmental processes to follow particular trajectories, despite external or internal perturbation. Canalization is the tendency for development of a specific genotype to follow the same trajectory under different conditions (different environments or different genetic backgrounds), while developmental stability is the tendency for the development of a specific genotype to follow the same trajectory under the same conditions. Morphological integration refers to the tendency for structures to show correlated variation because they develop in response to shared developmental processes or function in concert with other structures. All three phenomena are emergent properties of developmental systems that can affect the interaction of development and evolution. In this paper, we review the topics of canalization, developmental stability, and morphological integration and their relevance to primate and human evolution. We then test three developmentally motivated hypotheses about the patterning of variability components in the mammalian limb. We find that environmental variances and fluctuating asymmetries (FA) increase distally along the limb in adult macaques but not in fetal mice. We infer that the greater variability of more distal segments in macaques is due to postnatal mechanical effects. We also find that heritability and FA are significantly correlated when different limb measurements are compared in fetal mice. This supports the idea that the mechanisms underlying canalization and developmental stability are related. Finally, we report that the covariation structure of fore- and hindlimb skeletal elements shows evidence for morphological integration between serially homologous structures between the limbs. This is evidence for the existence of developmental modules that link structures between the limbs. Such modules would produce covariation that would need to be overcome by selection for divergence in hind- and forelimb morphology.


Figures

Fig. 1
Fig. 1
Epigenetic landscape of Waddington (1957). Topography of landscape represents genetic predetermination to follow particular developmental pathways. Ball rolling down landscape represents a particular developmental process playing out within an individual. Such pathways are represented by valleys that lead to discrete developmental endpoints. Steepness of sides of valleys represents degree of buffering against perturbations affecting developmental process. Modified from Waddington (1957).
Fig. 2
Fig. 2
Schematic illustration of modularity concept, showing three hierarchically arranged modules. Gene 1 affects all characters and thus comprises a higher-order module. Effects on body size would be an example of this. Effects of other genes and their pleiotropic interactions are confined to subsets of characters, each of which comprises a module. This figure is based on Wagner (1996b).
Fig. 3
Fig. 3
3D reconstructions of brachyrrhine heterozygote (A) and C3H wild-type littermate (B). Highlighted region is most directly affected by brachyrrhine (Br) mutation.
Fig. 4
Fig. 4
Scanning electromicrographs of human forelimb buds on gestational day 29. A: Transverse section through a limb bud. From Kelley (1985). B: External view at a similar stage of development. AER, apical ectodermal ridge; LM, limb mesenchyme; PZ, progress zone; DE, dorsal ectoderm; VE, ventral ectoderm; ZPA, zone of polarizing activity. From Larsen (2001).
Fig. 5
Fig. 5
Schematic depiction of hypothesized modules affecting patterning of morphological integration in vertebrate limb.
Fig. 6
Fig. 6
Landmarks collected for fore- and hindlimb elements for CD1 sample. Specimen shown is a neonate (20.5-day sample). Mouse fetuses were cleared and stained with alcian blue for cartilage, and alizarin red for bone/osteoid.
Fig. 7
Fig. 7
Variability along limb in Macaca mulatta. A: Size-relative (0.7982(MSsjMSm)/M on In transformed data) against limb segment for the forelimb and hindlimb. Significance values for comparisons between segments are provided in Table 2. B: Environmental variance (1 – h2) against limb segment. C: Overall phenotypic variance. In C, the overall variance is the mean of male and female variances (Table 4).
Fig. 8
Fig. 8
Variability along limb in CD1 mice. A: Size-relative FA (0.7982(MSsjMSm)/M on In transformed data) against limb segment for forelimb and hindlimb. Significance values for comparisons between segments are provided in Table 2. B: Environmental variance (1 – h2) against limb segment. C: Overall phenotypic variance.
Fig. 9
Fig. 9
Heritability plotted against size-relative FA for 262 within-element interlandmark distances in CD1 mice. FA10 values are averaged across age groups for each trait. Heritability is calculated on z-transformed sample, adjusted for differences in mean and variance between age groups. Pearson’s correlation coefficient (r = 0.48) is significant at P < 0.001. Graph shows a general relationship between FA and magnitude of environmental variance in CD1 mouse limb sample.
Fig. 10
Fig. 10
Percentage of total variance explained by principal components for mouse Euclidean distance matrix data and rhesus macaque linear measurement data. Corresponding histogram for CD1 mouse centroid size data is very similar.
Fig. 11
Fig. 11
Dendrograms derived from hierarchical cluster analysis, using Ward’s method for CD1 mouse centroid size correlation matrix (A) and the rhesus macaque phenotypic correlation matrix (B).
Fig. 12
Fig. 12
Dendrograms derived from hierarchical cluster analysis, using Ward’s method for rhesus macaque genetic correlation matrix.

References

    1. Ackermann RR, Cheverud JM. Phenotypic covariance structure in tamarins (genus Saguinus): a comparison of variation patterns using matrix correlation and common principal component analysis. Am J Phys Anthropol. 2000;111:489–501. - PubMed
    1. Ahn DG, Kourakis MJ, Rohde LA, Silver LM, Ho RK. T-box gene tbx5 is essential for formation of the pectoral limb bud. Nature. 2002;417:754–758. - PubMed
    1. Alberch P. Developmental constraints in evolutionary processes. In: Bonner JT, editor. Development in evolution. Berlin and New York: Springer-Verlag; 1982. pp. 313–332.
    1. Albert AM, Greene DL. Bilateral asymmetry in skeletal growth and maturation as an indicator of environmental stress. Am J Phys Anthropol. 1999;110:341–349. - PubMed
    1. Atchley WR. Genetic and developmental aspects of variability in the mammalian mandible. In: Hanken J, Hall BK, editors. The skull: development. Chicago: University of Chicago Press; 1993. pp. 207–247.

Publication types

LinkOut - more resources